29
/it/
it
AIzaSyAYiBZKx7MnpbEhh9jyipgxe19OcubqV5w
April 1, 2024
175445
Latvia
LVA
true
2
1
Imports of goods and services (% of GDP)
2016,2015,2014,2013,2012,2011,2010,2009,2008,2007,2006,2005,2004,2003,2002,2001,2000,1999,1998,1997,1996
Download
Biblioteca di statistiche globali →Latvia →

Imports of goods and services (% of GDP)

Queste statistiche in altri paesi:
AfghanistanAlbaniaAlgeriaAngolaAntigua and BarbudaArab WorldArgentinaArmeniaArubaAustraliaAustriaAzerbaijanBahamas, TheBahrainBangladeshBarbadosBelarusBelgiumBelizeBeninBermudaBhutanBoliviaBosnia and HerzegovinaBotswanaBrazilBrunei DarussalamBulgariaBurkina FasoBurundiCabo VerdeCambodiaCameroonCanadaCaribbean small statesCentral African RepublicCentral Europe and the BalticsChadChileChinaColombiaComorosCongo, Dem. Rep.Congo, Rep.Costa RicaCote d'IvoireCroatiaCubaCyprusCzech RepublicDenmarkDjiboutiDominicaDominican RepublicEarly-demographic dividendEast Asia & PacificEast Asia & Pacific (excluding high income)East Asia & Pacific (IDA & IBRD countries)EcuadorEgypt, Arab Rep.El SalvadorEquatorial GuineaEritreaEstoniaEthiopiaEuro areaEurope & Central AsiaEurope & Central Asia (excluding high income)Europe & Central Asia (IDA & IBRD countries)European UnionFaroe IslandsFijiFinlandFragile and conflict affected situationsFranceFrench PolynesiaGabonGambia, TheGeorgiaGermanyGhanaGreeceGrenadaGuatemalaGuineaGuinea-BissauGuyanaHaitiHeavily indebted poor countries (HIPC)High incomeHondurasHong Kong SAR, ChinaHungaryIBRD onlyIcelandIDA & IBRD totalIDA blendIDA onlyIDA totalIndiaIndonesiaIran, Islamic Rep.IraqIrelandIsraelItalyJamaicaJapanJordanKazakhstanKenyaKiribatiKorea, Rep.KosovoKuwaitKyrgyz RepublicLao PDRLate-demographic dividendLatin America & Caribbean Latin America & Caribbean (excluding high income)Latin America & the Caribbean (IDA & IBRD countries)LatviaLeast developed countries: UN classificationLebanonLesothoLiberiaLibyaLithuaniaLow & middle incomeLow incomeLower middle incomeLuxembourgMacao SAR, ChinaMacedonia, FYRMadagascarMalawiMalaysiaMaldivesMaliMaltaMauritaniaMauritiusMexicoMicronesia, Fed. Sts.Middle East & North AfricaMiddle East & North Africa (excluding high income)Middle East & North Africa (IDA & IBRD countries)Middle incomeMoldovaMongoliaMontenegroMoroccoMozambiqueMyanmarNamibiaNepalNetherlandsNew CaledoniaNew ZealandNicaraguaNigerNigeriaNorth AmericaNorwayOECD membersOmanOther small statesPacific island small statesPakistanPalauPanamaPapua New GuineaParaguayPeruPhilippinesPolandPortugalPost-demographic dividendPre-demographic dividendPuerto RicoQatarRomaniaRussian FederationRwandaSamoaSaudi ArabiaSenegalSerbiaSeychellesSierra LeoneSingaporeSlovak RepublicSloveniaSmall statesSolomon IslandsSomaliaSouth AfricaSouth AsiaSouth Asia (IDA & IBRD)South SudanSpainSri LankaSt. Kitts and NevisSt. LuciaSt. Vincent and the GrenadinesSub-Saharan Africa Sub-Saharan Africa (excluding high income)Sub-Saharan Africa (IDA & IBRD countries)SudanSurinameSwazilandSwedenSwitzerlandSyrian Arab RepublicTajikistanTanzaniaThailandTimor-LesteTogoTongaTrinidad and TobagoTunisiaTurkeyTurkmenistanUgandaUkraineUnited Arab EmiratesUnited KingdomUnited StatesUpper middle incomeUruguayUzbekistanVanuatuVenezuela, RBVietnamWest Bank and GazaWorldYemen, Rep.ZambiaZimbabwe
Linea del tempo:
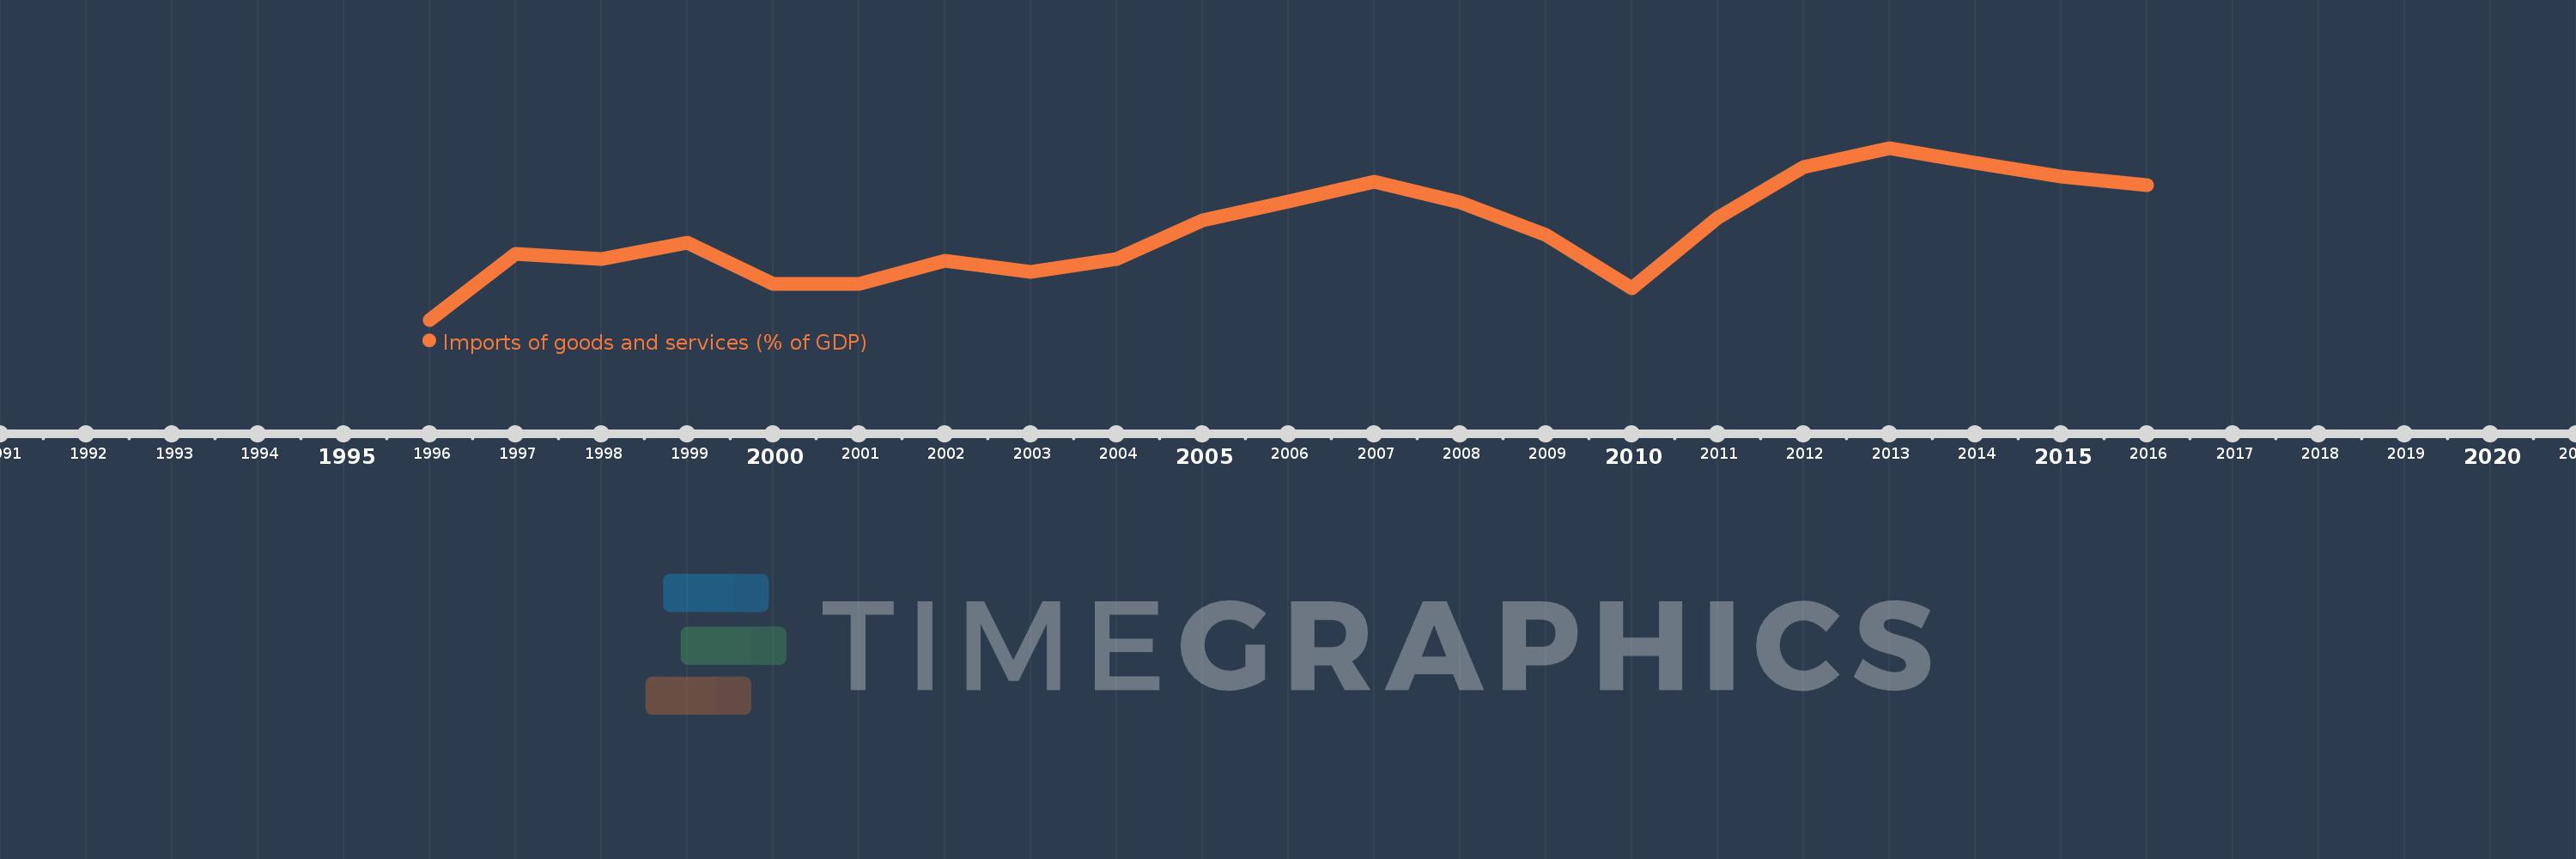
Questa scala temporale mostra un grafico dal 1996 anno al 2016 anno. Latvia. I dati fino ad 1995 anno non disponibili. Il numero di osservazioni attuali secondo i date: 21.
La fonte (nome):
Indicatori dello sviluppo mondiale
La fonte (organizzazione):
World Bank national accounts data, and OECD National Accounts data files.
Categorie:
Economy & Growth, Trade
sono stati aggiornati
23 apr 2017 anni
Indicatori delle variazioni dei valori per anni
In media:
53.259
Minima:
39.31
1 gen 1996 anni
Massimo:
65.868
1 gen 2013 anni
Alla data di osservazione
Valore
Variazione assoluta
La variazione rispetto al valore precedente
1 gen 1996 anni
39.31
+39.31
0.0%
1 gen 1997 anni
49.467
+10.157
25.84%
1 gen 1998 anni
48.757
-0.71
-1.44%
1 gen 1999 anni
51.255
+2.498
5.12%
1 gen 2000 anni
44.84
-6.415
-12.52%
1 gen 2001 anni
44.87
+0.03
0.07%
1 gen 2002 anni
48.438
+3.568
7.95%
1 gen 2003 anni
46.719
-1.719
-3.55%
1 gen 2004 anni
48.662
+1.943
4.16%
1 gen 2005 anni
54.632
+5.97
12.27%
1 gen 2006 anni
57.658
+3.026
5.54%
1 gen 2007 anni
60.645
+2.987
5.18%
1 gen 2008 anni
57.472
-3.173
-5.23%
1 gen 2009 anni
52.459
-5.013
-8.72%
1 gen 2010 anni
44.224
-8.236
-15.7%
1 gen 2011 anni
55.132
+10.908
24.67%
1 gen 2012 anni
62.898
+7.766
14.09%
1 gen 2013 anni
65.868
+2.97
4.72%
1 gen 2014 anni
63.541
-2.327
-3.53%
1 gen 2015 anni
61.485
-2.056
-3.24%
1 gen 2016 anni
60.112
-1.374
-2.23%
Classificazione dei paesi secondo i statistiche attuali per anni

Commenti:

Inviare
PremiumAbout & FeedbackAccordoPrivatezza
logo
© 2022 Selected Technologies LLC – Morgan Hill, California