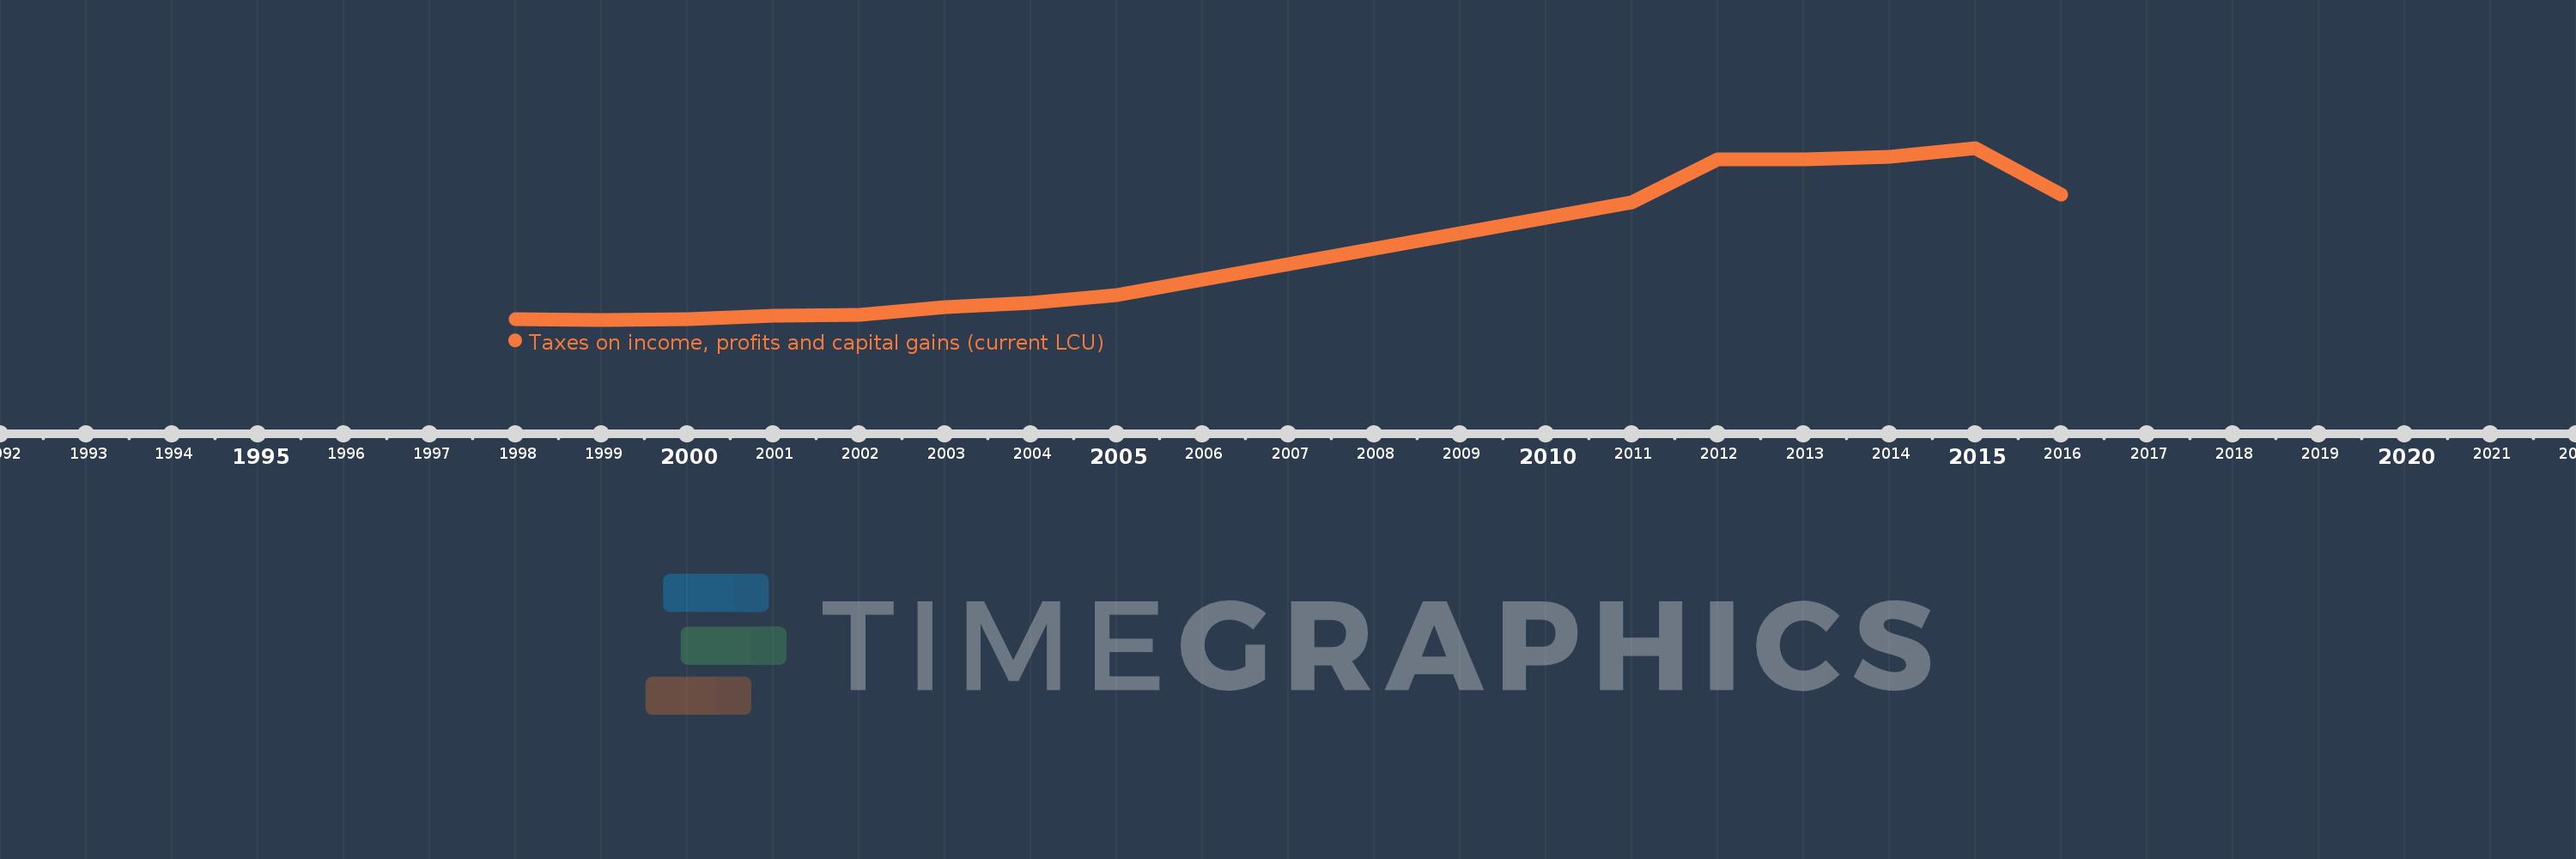
Questa scala temporale mostra un grafico dal 1998 anno al 2016 anno. Kazakhstan. I dati fino ad 1997 anno non disponibili. Il numero di osservazioni attuali secondo i date: 14.
La fonte (nome):
Indicatori dello sviluppo mondiale
La fonte (organizzazione):
International Monetary Fund, Government Finance Statistics Yearbook and data files.
Categorie:
Public Sector
sono stati aggiornati
23 apr 2017 anni
Indicatori delle variazioni dei valori per anni
In media:
1.038 Trln
Minima:
22.366 Mlrd
1 gen 1999 anni
Massimo:
2.562 Trln
1 gen 2015 anni
Alla data di osservazione
Valore
Variazione assoluta
La variazione rispetto al valore precedente
1 gen 1998 anni
26.651 Mlrd
+26.651 Mlrd
0.0%
1 gen 1999 anni
22.366 Mlrd
-4.285 Mlrd
-16.08%
1 gen 2000 anni
28.177 Mlrd
+5.811 Mlrd
25.98%
1 gen 2001 anni
82.963 Mlrd
+54.786 Mlrd
194.43%
1 gen 2002 anni
90.682 Mlrd
+7.719 Mlrd
9.3%
1 gen 2003 anni
209.054 Mlrd
+118.372 Mlrd
130.54%
1 gen 2004 anni
272.632 Mlrd
+63.578 Mlrd
30.41%
1 gen 2005 anni
382.814 Mlrd
+110.182 Mlrd
40.41%
1 gen 2011 anni
1.76 Trln
+1.377 Trln
359.76%
1 gen 2012 anni
2.398 Trln
+637.911 Mlrd
36.24%
1 gen 2013 anni
2.388 Trln
-10.196 Mlrd
-0.43%
1 gen 2014 anni
2.435 Trln
+47.396 Mlrd
1.98%
1 gen 2015 anni
2.562 Trln
+126.576 Mlrd
5.2%
1 gen 2016 anni
1.869 Trln
-692.542 Mlrd
-27.03%
Classificazione dei paesi secondo i statistiche attuali per anni