30
/it/
AIzaSyAYiBZKx7MnpbEhh9jyipgxe19OcubqV5w
April 1, 2024
163169
Jamaica
JAM
true
2
1
Prevalence of stunting, height for age (% of children under 5)
2013,2011,2009,2008,2007,2005,2003,2002,2001,2000,1999,1998,1997,1996,1995,1994,1993,1992,1990,1979
Download
Biblioteca di statistiche globali →Jamaica →

Prevalence of stunting, height for age (% of children under 5)

Queste statistiche in altri paesi:

AfghanistanAlbaniaAlgeriaAngolaArgentinaArmeniaAustraliaAzerbaijanBahrainBangladeshBarbadosBelarusBelizeBeninBhutanBoliviaBosnia and HerzegovinaBotswanaBrazilBrunei DarussalamBulgariaBurkina FasoBurundiCabo VerdeCambodiaCameroonCanadaCentral African RepublicChadChileChinaColombiaComorosCongo, Dem. Rep.Congo, Rep.Costa RicaCote d'IvoireCroatiaCubaCzech RepublicDjiboutiDominican RepublicEast Asia & PacificEast Asia & Pacific (excluding high income)EcuadorEgypt, Arab Rep.El SalvadorEquatorial GuineaEritreaEthiopiaEurope & Central AsiaEurope & Central Asia (excluding high income)FijiFragile and conflict affected situationsGabonGambia, TheGeorgiaGermanyGhanaGreeceGuatemalaGuineaGuinea-BissauGuyanaHaitiHigh incomeHondurasHungaryIDA & IBRD totalIDA totalIndiaIndonesiaIran, Islamic Rep.IraqItalyJamaicaJapanJordanKazakhstanKenyaKiribatiKorea, Dem. People’s Rep.Korea, Rep.KuwaitKyrgyz RepublicLao PDRLatin America & Caribbean Latin America & Caribbean (excluding high income)LebanonLesothoLiberiaLibyaLow & middle incomeLow incomeLower middle incomeMacedonia, FYRMadagascarMalawiMalaysiaMaldivesMaliMauritaniaMauritiusMexicoMiddle East & North AfricaMiddle East & North Africa (excluding high income)Middle incomeMoldovaMongoliaMontenegroMoroccoMozambiqueMyanmarNamibiaNauruNepalNetherlandsNicaraguaNigerNigeriaNorth AmericaOmanPakistanPanamaPapua New GuineaParaguayPeruPhilippinesQatarRomaniaRwandaSamoaSao Tome and PrincipeSaudi ArabiaSenegalSerbiaSeychellesSierra LeoneSingaporeSolomon IslandsSomaliaSouth AfricaSouth AsiaSouth SudanSri LankaSt. LuciaSub-Saharan Africa Sub-Saharan Africa (excluding high income)SudanSurinameSwazilandSyrian Arab RepublicTajikistanTanzaniaThailandTimor-LesteTogoTongaTrinidad and TobagoTunisiaTurkeyTurkmenistanTuvaluUgandaUkraineUnited KingdomUnited StatesUpper middle incomeUruguayUzbekistanVanuatuVenezuela, RBVietnamWest Bank and GazaWorldYemen, Rep.ZambiaZimbabwe

Linea del tempo:

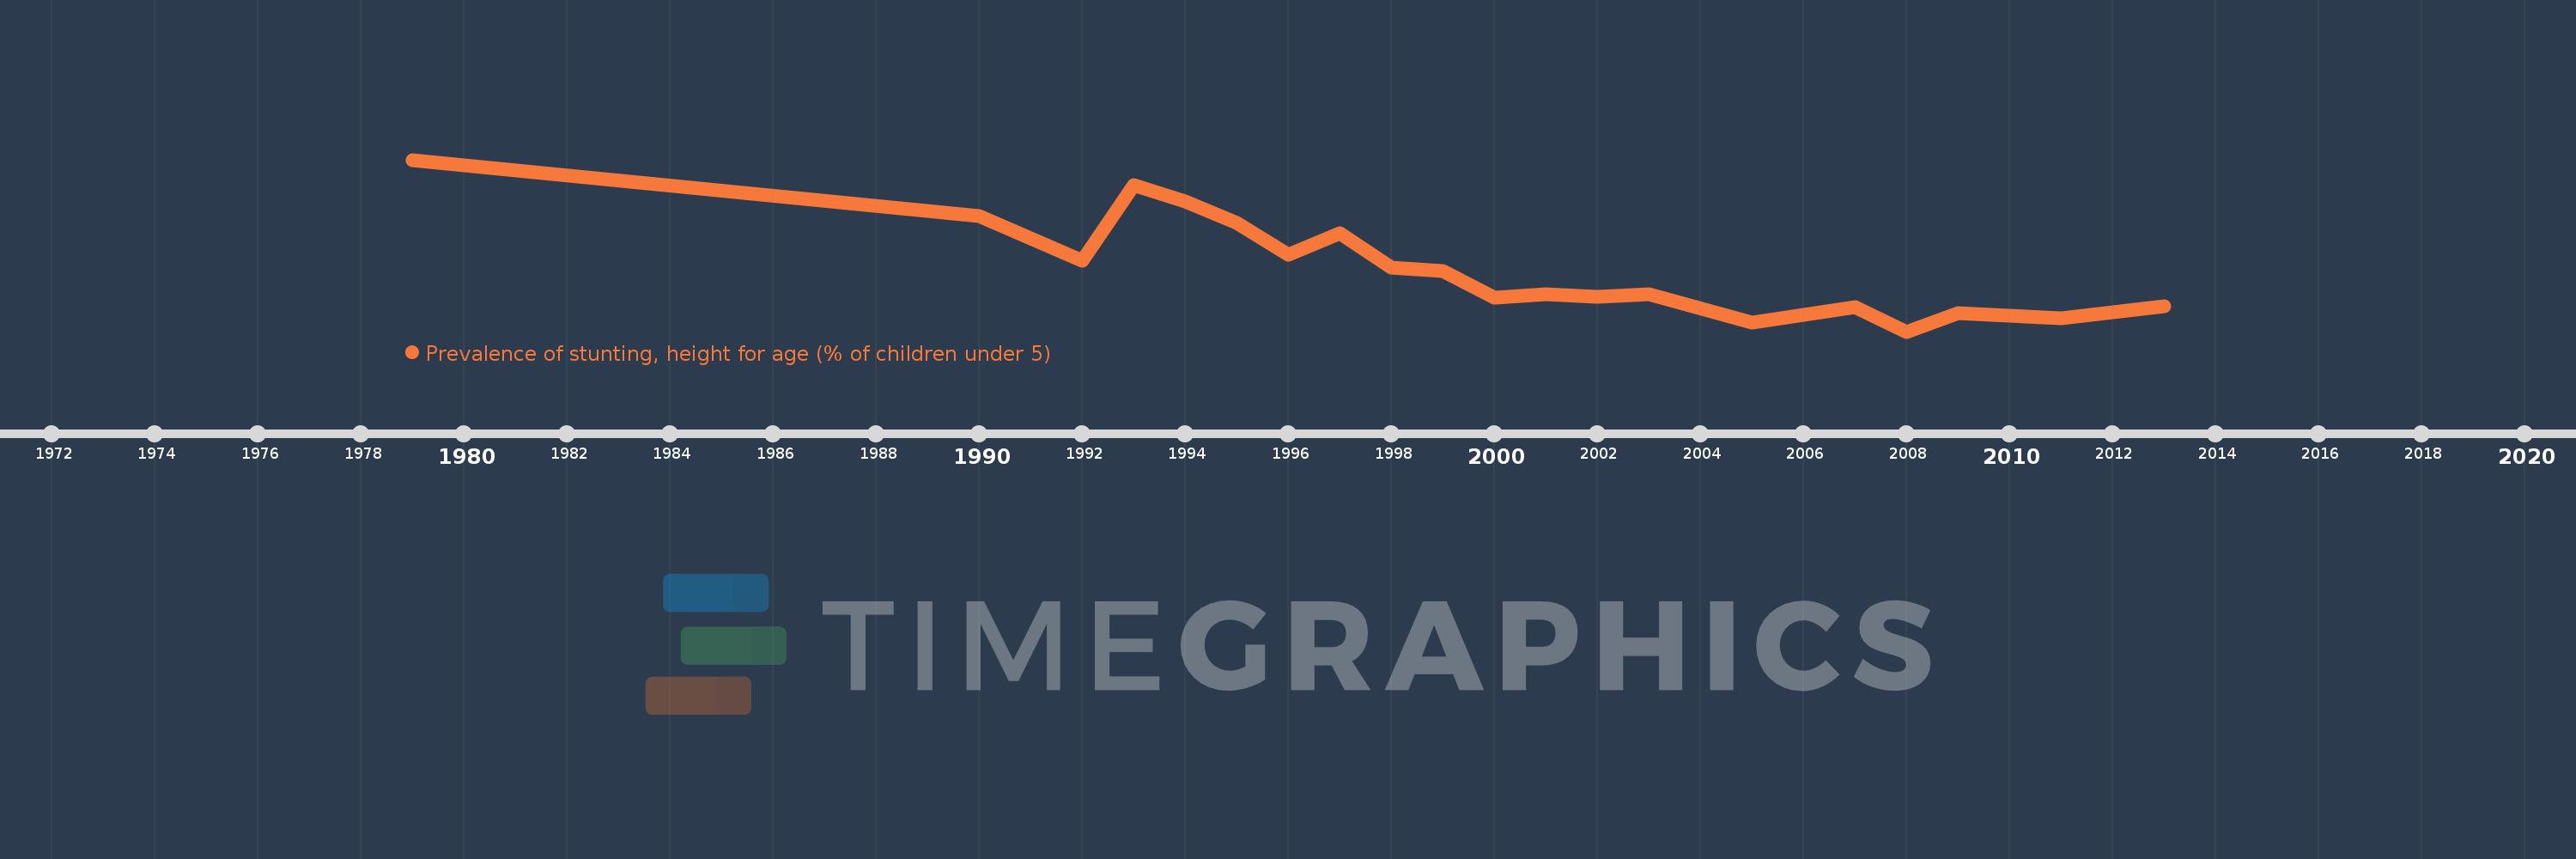
Questa scala temporale mostra un grafico dal 1979 anno al 2013 anno. Jamaica. I dati fino ad 1978 anno non disponibili. Il numero di osservazioni attuali secondo i date: 20.

La fonte (nome):

Indicatori dello sviluppo mondiale

La fonte (organizzazione):

World Health Organization, Global Database on Child Growth and Malnutrition. Country-level data are unadjusted data from national surveys, and thus may not be comparable across countries. Adjusted, comparable data are available at http://www.who.int/nutgrowthdb/en. Aggregation is based on UNICEF, WHO, and the World Bank harmonized dataset (adjusted, comparable data) and methodology.

Categorie:

Health, Aid Effectiveness

sono stati aggiornati

23 apr 2017 anni

Indicatori delle variazioni dei valori per anni

In media:
8.56
Minima:
3.8
1 gen 2008 anni
Massimo:
16.6
1 gen 1979 anni
Alla data di osservazione
Valore
Variazione assoluta
La variazione rispetto al valore precedente
1 gen 1979 anni
16.6
+16.6
0.0%
1 gen 1990 anni
12.4
-4.2
-25.3%
1 gen 1992 anni
9.1
-3.3
-26.61%
1 gen 1993 anni
14.7
+5.6
61.54%
1 gen 1994 anni
13.5
-1.2
-8.16%
1 gen 1995 anni
11.9
-1.6
-11.85%
1 gen 1996 anni
9.5
-2.4
-20.17%
1 gen 1997 anni
11.1
+1.6
16.84%
1 gen 1998 anni
8.6
-2.5
-22.52%
1 gen 1999 anni
8.3
-0.3
-3.49%
1 gen 2000 anni
6.3
-2.0
-24.1%
1 gen 2001 anni
6.6
+0.3
4.76%
1 gen 2002 anni
6.4
-0.2
-3.03%
1 gen 2003 anni
6.6
+0.2
3.12%
1 gen 2005 anni
4.5
-2.1
-31.82%
1 gen 2007 anni
5.6
+1.1
24.44%
1 gen 2008 anni
3.8
-1.8
-32.14%
1 gen 2009 anni
5.2
+1.4
36.84%
1 gen 2011 anni
4.8
-0.4
-7.69%
1 gen 2013 anni
5.7
+0.9
18.75%

Classificazione dei paesi secondo i statistiche attuali per anni