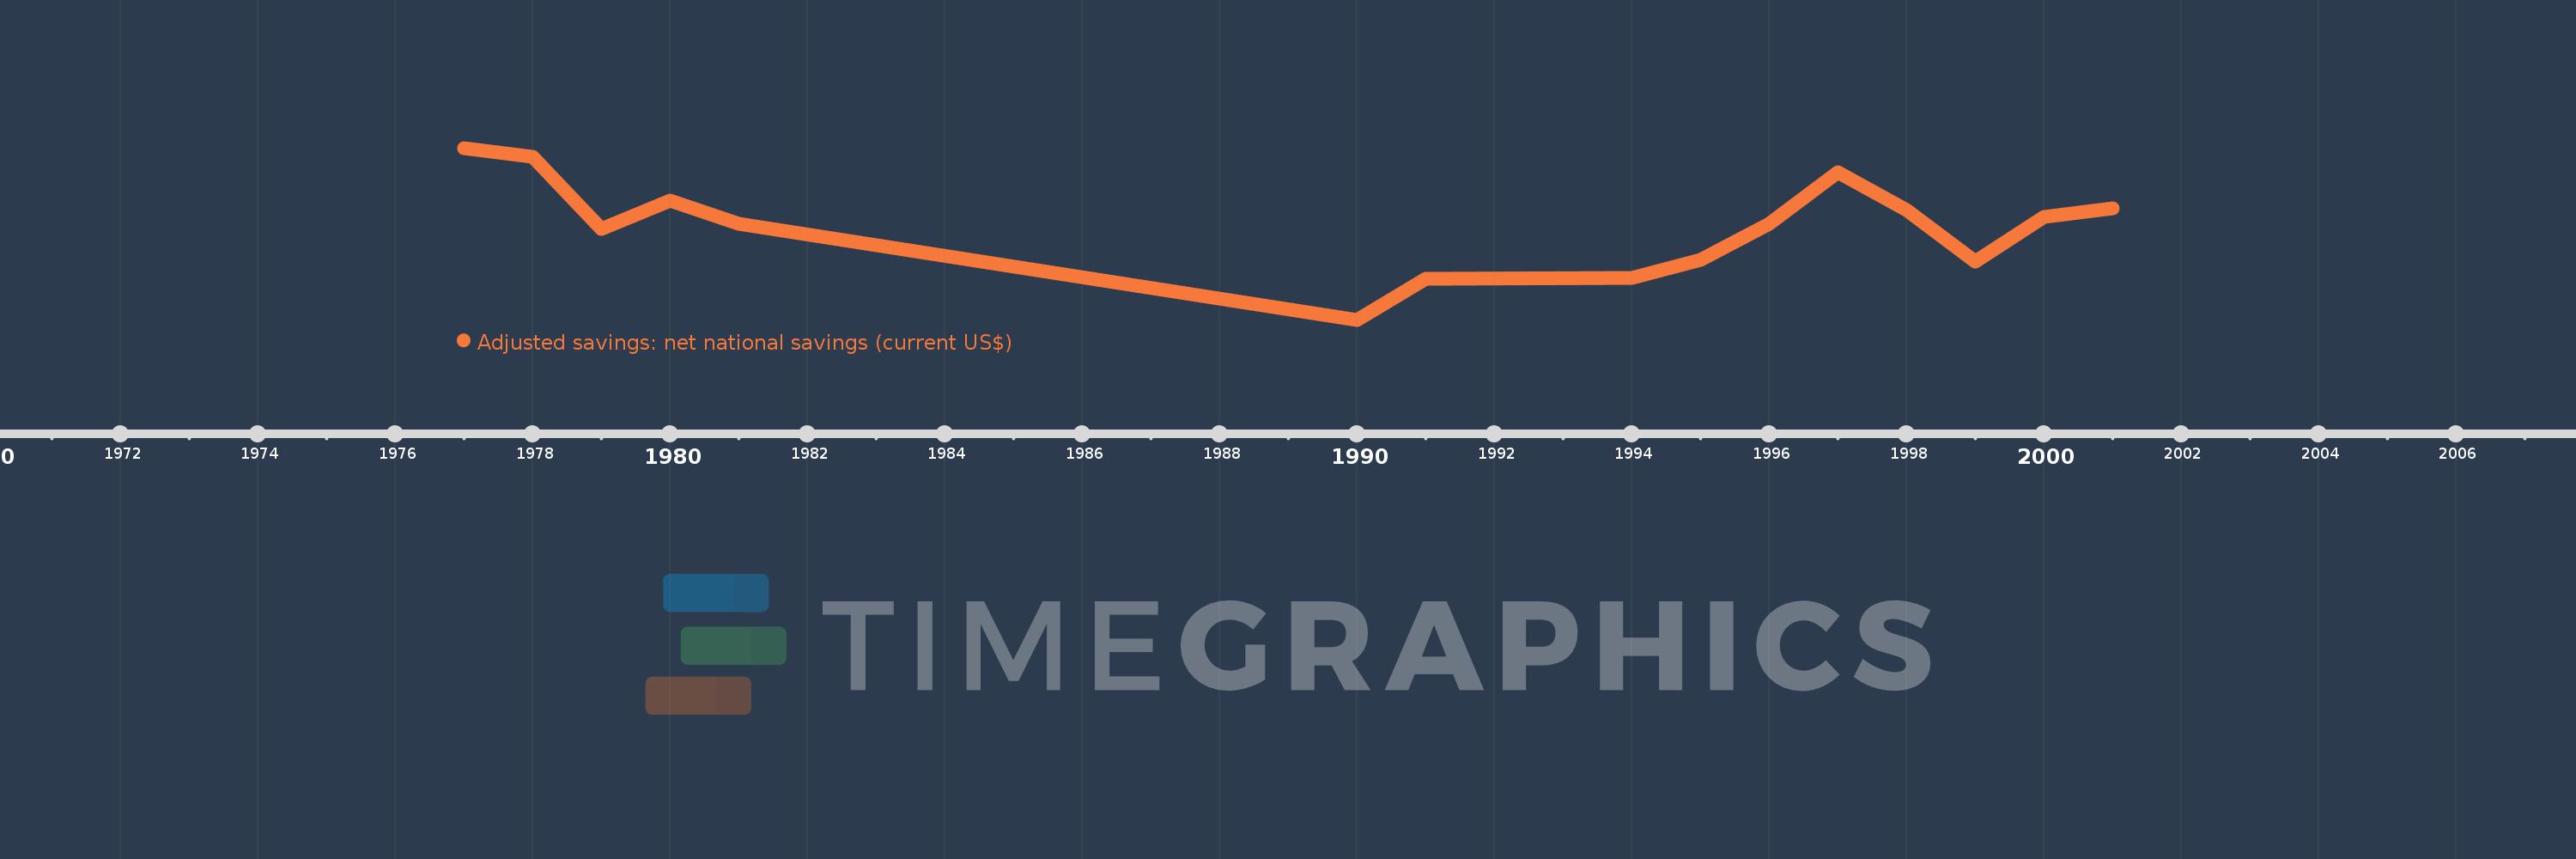
Questa scala temporale mostra un grafico dal 1977 anno al 2001 anno. Iran, Islamic Rep.. I dati fino ad 1976 anno non disponibili. Il numero di osservazioni attuali secondo i date: 15.
La fonte (nome):
Indicatori dello sviluppo mondiale
La fonte (organizzazione):
World Bank staff estimates based on sources and methods in World Bank's "The Changing Wealth of Nations: Measuring Sustainable Development in the New Millennium" (2011).
Categorie:
Economy & Growth, Environment
sono stati aggiornati
23 apr 2017 anni
Indicatori delle variazioni dei valori per anni
In media:
23.087 Mlrd
Minima:
7.583 Mlrd
1 gen 1990 anni
Massimo:
35.954 Mlrd
1 gen 1977 anni
Alla data di osservazione
Valore
Variazione assoluta
La variazione rispetto al valore precedente
1 gen 1977 anni
35.954 Mlrd
+35.954 Mlrd
0.0%
1 gen 1978 anni
34.459 Mlrd
-1.494 Mlrd
-4.16%
1 gen 1979 anni
22.589 Mlrd
-11.87 Mlrd
-34.45%
1 gen 1980 anni
27.248 Mlrd
+4.659 Mlrd
20.63%
1 gen 1981 anni
23.408 Mlrd
-3.84 Mlrd
-14.09%
1 gen 1990 anni
7.583 Mlrd
-15.825 Mlrd
-67.61%
1 gen 1991 anni
14.323 Mlrd
+6.74 Mlrd
88.88%
1 gen 1994 anni
14.471 Mlrd
+147.793 Mln
1.03%
1 gen 1995 anni
17.466 Mlrd
+2.996 Mlrd
20.7%
1 gen 1996 anni
23.458 Mlrd
+5.992 Mlrd
34.3%
1 gen 1997 anni
31.897 Mlrd
+8.439 Mlrd
35.98%
1 gen 1998 anni
25.694 Mlrd
-6.203 Mlrd
-19.45%
1 gen 1999 anni
17.215 Mlrd
-8.48 Mlrd
-33.0%
1 gen 2000 anni
24.58 Mlrd
+7.365 Mlrd
42.79%
1 gen 2001 anni
25.966 Mlrd
+1.386 Mlrd
5.64%
Classificazione dei paesi secondo i statistiche attuali per anni