Download Queste statistiche in altri paesi:
Linea del tempo:
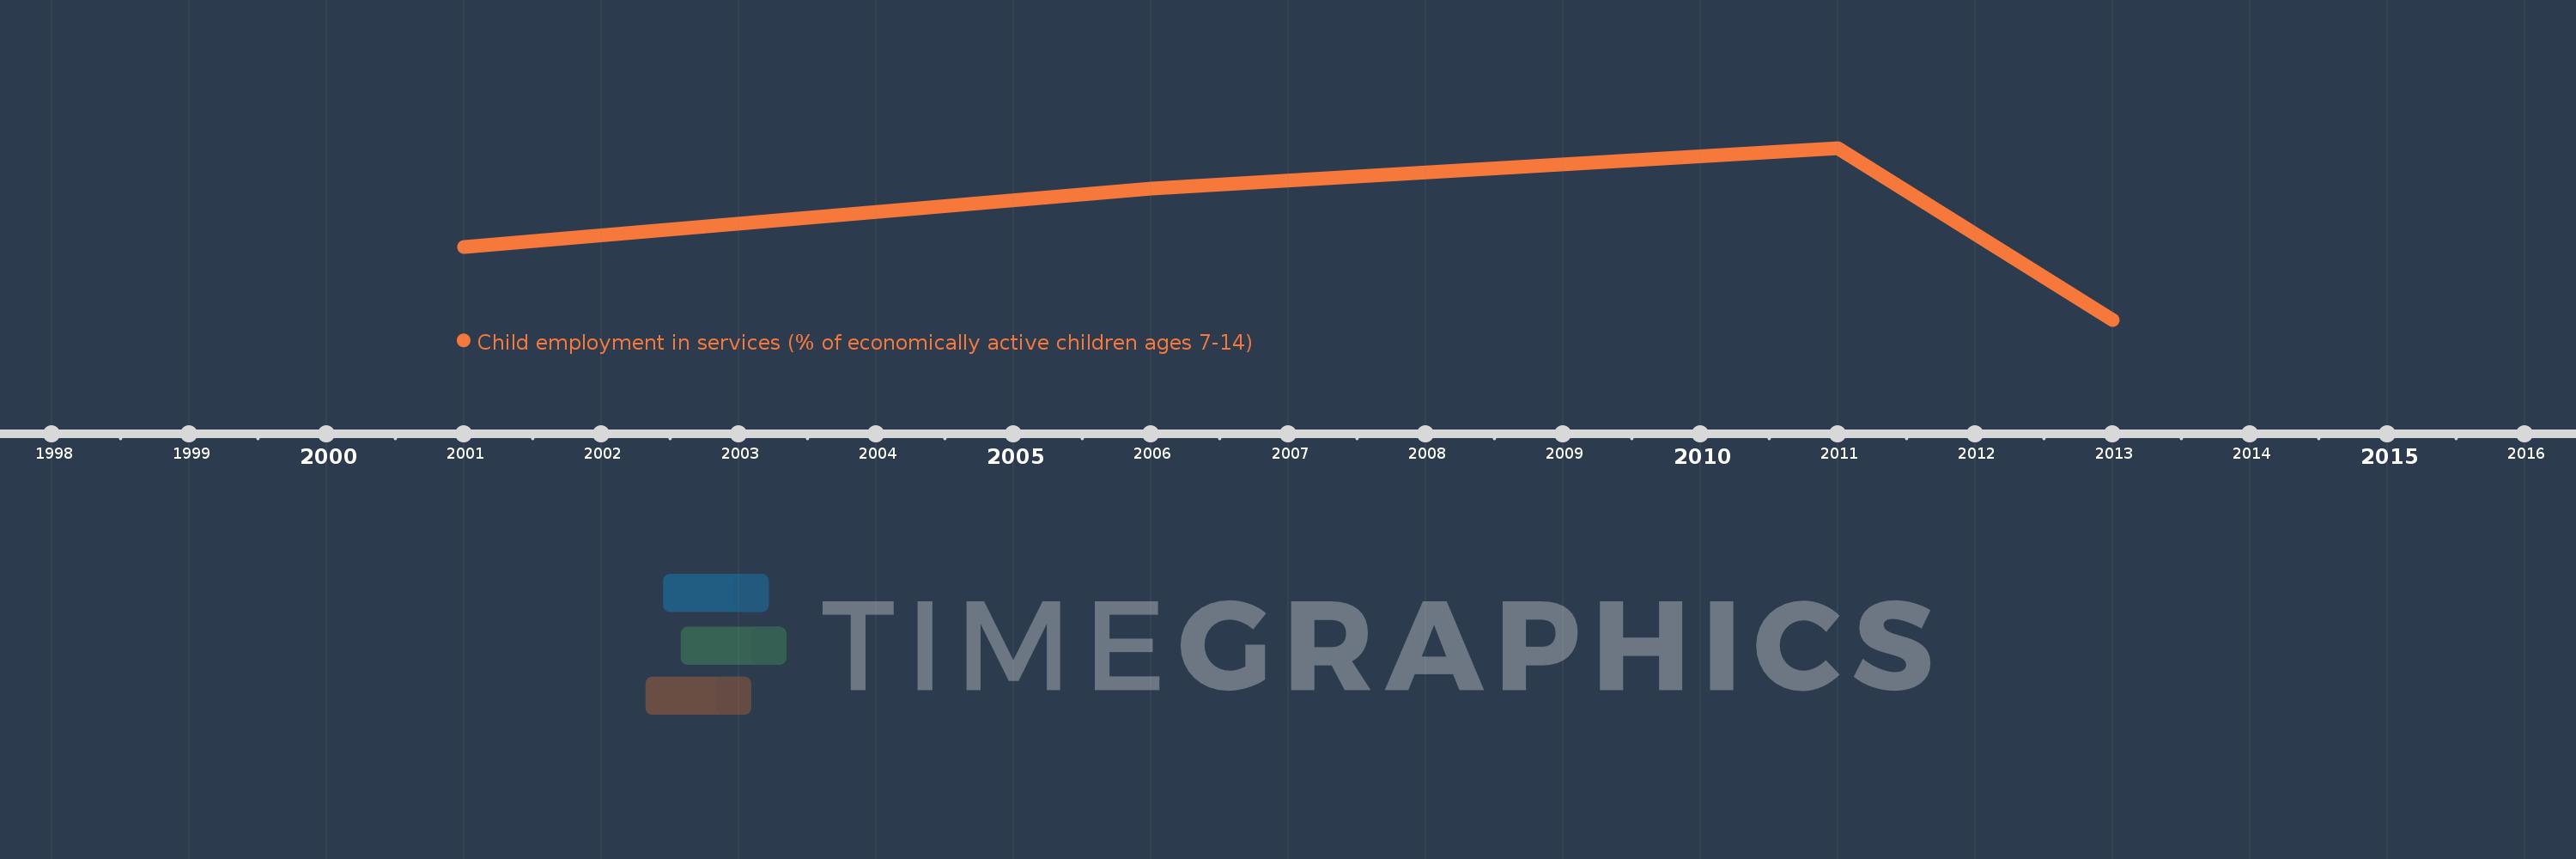
Questa scala temporale mostra un grafico dal 2001 anno al 2013 anno. India. I dati fino ad 2000 anno non disponibili. Il numero di osservazioni attuali secondo i date: 4.
La fonte (nome):
Indicatori dello sviluppo mondiale
La fonte (organizzazione):
Understanding Children's Work project based on data from ILO, UNICEF and the World Bank.
Categorie:
Social Protection & Labor
sono stati aggiornati
23 apr 2017 anni
Indicatori delle variazioni dei valori per anni
Minima:
10.43
1 gen 2013 anni
Massimo:
13.01
1 gen 2011 anni
Alla data di osservazione
Valore
Variazione assoluta
La variazione rispetto al valore precedente
1 gen 2001 anni
11.52
+11.52
0.0%
1 gen 2006 anni
12.4
+0.88
7.64%
1 gen 2011 anni
13.01
+0.61
4.92%
1 gen 2013 anni
10.43
-2.58
-19.83%
Classificazione dei paesi secondo i statistiche attuali per anni