33
/it/
AIzaSyAYiBZKx7MnpbEhh9jyipgxe19OcubqV5w
August 1, 2025
151270
Honduras
HND
true
2
1
Vulnerable employment, female (% of female employment)
2011,2010,2009,2008,2007,2006,2005,2004,2003,2002,2000,1999,1998,1997,1996,1995,1993,1992,1991
Download
Biblioteca di statistiche globali →Honduras →

Vulnerable employment, female (% of female employment)

Queste statistiche in altri paesi:

AlbaniaAlgeriaAntigua and BarbudaArgentinaArmeniaArubaAustriaAzerbaijanBahamas, TheBahrainBangladeshBarbadosBelarusBelgiumBelizeBeninBermudaBhutanBoliviaBosnia and HerzegovinaBotswanaBrazilBritish Virgin IslandsBrunei DarussalamBulgariaBurkina FasoBurundiCabo VerdeCambodiaCameroonCaribbean small statesCayman IslandsCentral Europe and the BalticsChadColombiaCongo, Rep.Costa RicaCote d'IvoireCroatiaCyprusCzech RepublicDenmarkDominicaDominican RepublicEarly-demographic dividendEcuadorEgypt, Arab Rep.El SalvadorEquatorial GuineaEstoniaEthiopiaEuro areaEurope & Central AsiaEurope & Central Asia (excluding high income)Europe & Central Asia (IDA & IBRD countries)European UnionFijiFinlandFranceFrench PolynesiaGabonGambia, TheGeorgiaGermanyGhanaGreeceGrenadaGuatemalaGuineaHondurasHong Kong SAR, ChinaHungaryIcelandIndiaIndonesiaIran, Islamic Rep.IrelandItalyJamaicaJordanKazakhstanKenyaKiribatiKosovoKuwaitKyrgyz RepublicLao PDRLatin America & Caribbean Latin America & Caribbean (excluding high income)Latin America & the Caribbean (IDA & IBRD countries)LatviaLebanonLesothoLiberiaLithuaniaLower middle incomeLuxembourgMacao SAR, ChinaMacedonia, FYRMadagascarMalawiMalaysiaMaldivesMaliMaltaMarshall IslandsMauritiusMiddle East & North AfricaMiddle East & North Africa (excluding high income)Middle East & North Africa (IDA & IBRD countries)MoldovaMongoliaMoroccoMozambiqueNamibiaNepalNetherlandsNicaraguaNigerNorwayPakistanPanamaParaguayPeruPhilippinesPolandPortugalQatarRomaniaRussian FederationRwandaSamoaSao Tome and PrincipeSaudi ArabiaSenegalSerbiaSeychellesSierra LeoneSingaporeSlovak RepublicSloveniaSouth AfricaSouth AsiaSouth Asia (IDA & IBRD)SpainSri LankaSt. Kitts and NevisSt. LuciaSt. Vincent and the GrenadinesSurinameSwazilandSwedenSwitzerlandSyrian Arab RepublicTajikistanTanzaniaThailandTimor-LesteTogoTongaTrinidad and TobagoTunisiaTurkeyTuvaluUgandaUkraineUnited Arab EmiratesUnited KingdomUruguayVanuatuVenezuela, RBVietnamWest Bank and GazaYemen, Rep.ZambiaZimbabwe

Linea del tempo:

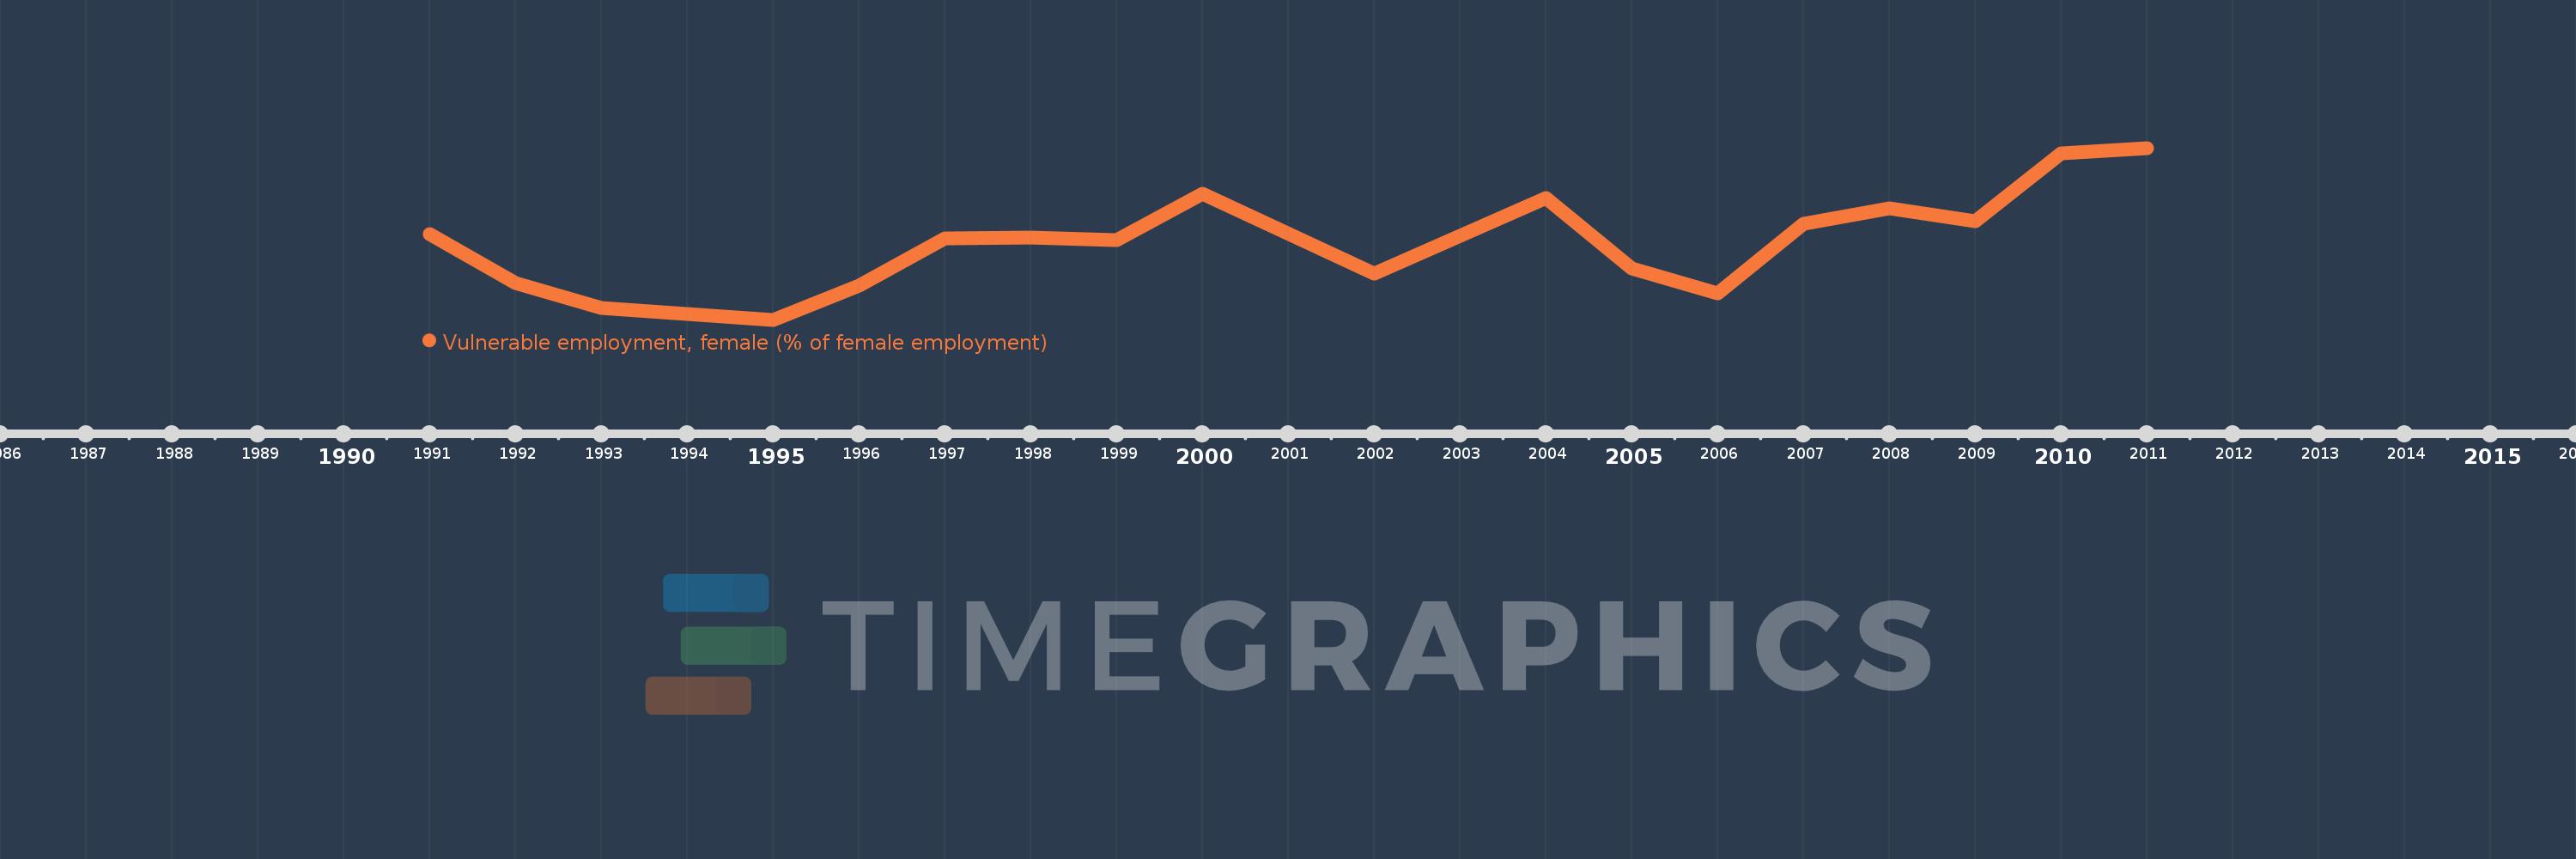
Questa scala temporale mostra un grafico dal 1991 anno al 2011 anno. Honduras. I dati fino ad 1990 anno non disponibili. Il numero di osservazioni attuali secondo i date: 19.

La fonte (nome):

Indicatori dello sviluppo mondiale

La fonte (organizzazione):

International Labour Organization, Key Indicators of the Labour Market database.

Categorie:

Social Protection & Labor, Gender, Social Development

sono stati aggiornati

23 apr 2017 anni

Indicatori delle variazioni dei valori per anni

In media:
49.763
Minima:
43.7
1 gen 1995 anni
Massimo:
56.8
1 gen 2011 anni
Alla data di osservazione
Valore
Variazione assoluta
La variazione rispetto al valore precedente
1 gen 1991 anni
50.2
+50.2
0.0%
1 gen 1992 anni
46.5
-3.7
-7.37%
1 gen 1993 anni
44.6
-1.9
-4.09%
1 gen 1995 anni
43.7
-0.9
-2.02%
1 gen 1996 anni
46.3
+2.6
5.95%
1 gen 1997 anni
49.9
+3.6
7.78%
1 gen 1998 anni
50.0
+0.1
0.2%
1 gen 1999 anni
49.8
-0.2
-0.4%
1 gen 2000 anni
53.3
+3.5
7.03%
1 gen 2002 anni
47.2
-6.1
-11.44%
1 gen 2003 anni
50.1
+2.9
6.14%
1 gen 2004 anni
53.0
+2.9
5.79%
1 gen 2005 anni
47.6
-5.4
-10.19%
1 gen 2006 anni
45.7
-1.9
-3.99%
1 gen 2007 anni
51.0
+5.3
11.6%
1 gen 2008 anni
52.2
+1.2
2.35%
1 gen 2009 anni
51.2
-1.0
-1.92%
1 gen 2010 anni
56.4
+5.2
10.16%
1 gen 2011 anni
56.8
+0.4
0.71%

Classificazione dei paesi secondo i statistiche attuali per anni