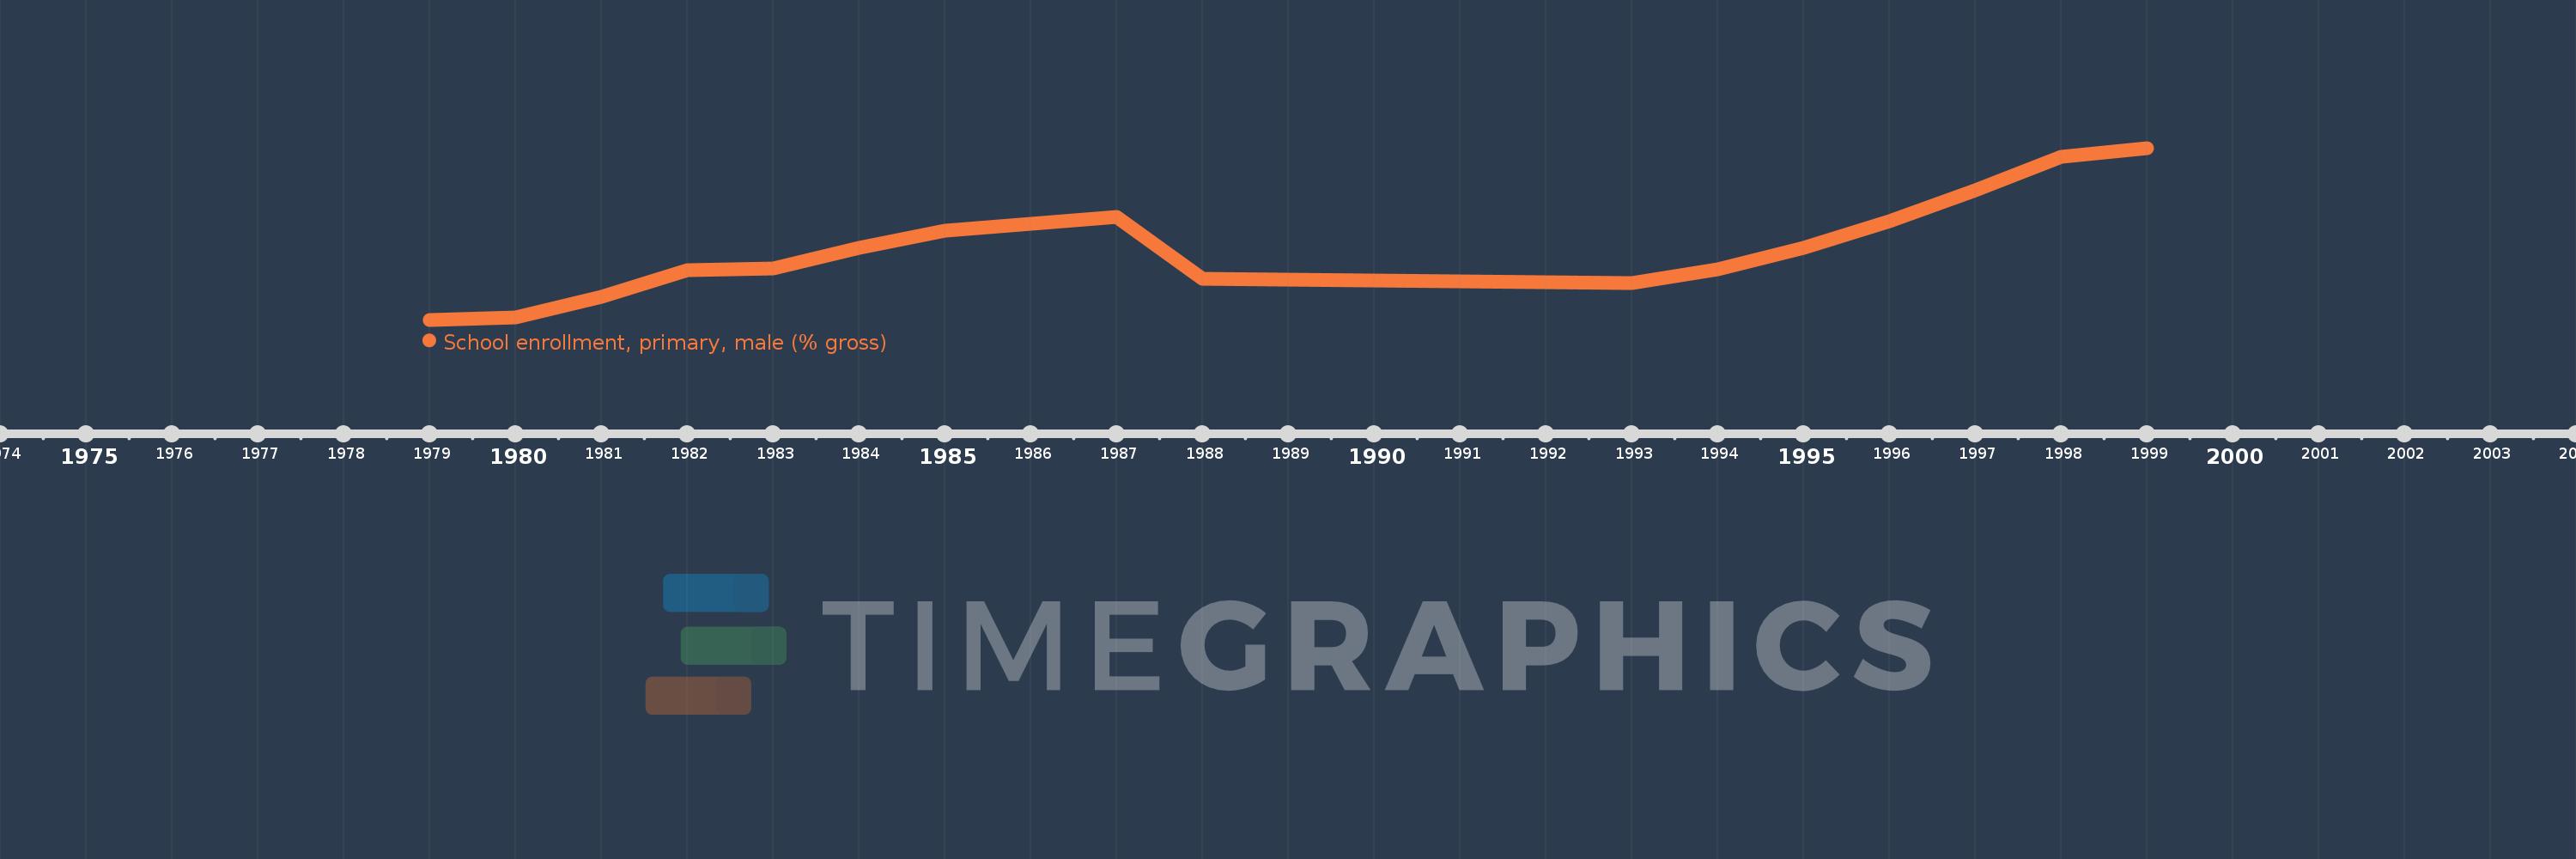
Questa scala temporale mostra un grafico dal 1979 anno al 1999 anno. Haiti. I dati fino ad 1978 anno non disponibili. Il numero di osservazioni attuali secondo i date: 17.
La fonte (nome):
Indicatori dello sviluppo mondiale
La fonte (organizzazione):
United Nations Educational, Scientific, and Cultural Organization (UNESCO) Institute for Statistics.
Categorie:
Education, Gender
sono stati aggiornati
23 apr 2017 anni
Indicatori delle variazioni dei valori per anni
In media:
86.395
Minima:
66.533
1 gen 1979 anni
Massimo:
112.966
1 gen 1999 anni
Alla data di osservazione
Valore
Variazione assoluta
La variazione rispetto al valore precedente
1 gen 1979 anni
66.533
+66.533
0.0%
1 gen 1980 anni
67.062
+0.529
0.8%
1 gen 1981 anni
72.829
+5.768
8.6%
1 gen 1982 anni
79.952
+7.122
9.78%
1 gen 1983 anni
80.356
+0.405
0.51%
1 gen 1984 anni
85.997
+5.64
7.02%
1 gen 1985 anni
90.58
+4.584
5.33%
1 gen 1986 anni
92.576
+1.996
2.2%
1 gen 1987 anni
94.376
+1.8
1.94%
1 gen 1988 anni
77.589
-16.787
-17.79%
1 gen 1993 anni
76.397
-1.192
-1.54%
1 gen 1994 anni
80.156
+3.758
4.92%
1 gen 1995 anni
86.024
+5.868
7.32%
1 gen 1996 anni
93.163
+7.139
8.3%
1 gen 1997 anni
101.6
+8.437
9.06%
1 gen 1998 anni
110.561
+8.962
8.82%
1 gen 1999 anni
112.966
+2.405
2.18%
Classificazione dei paesi secondo i statistiche attuali per anni