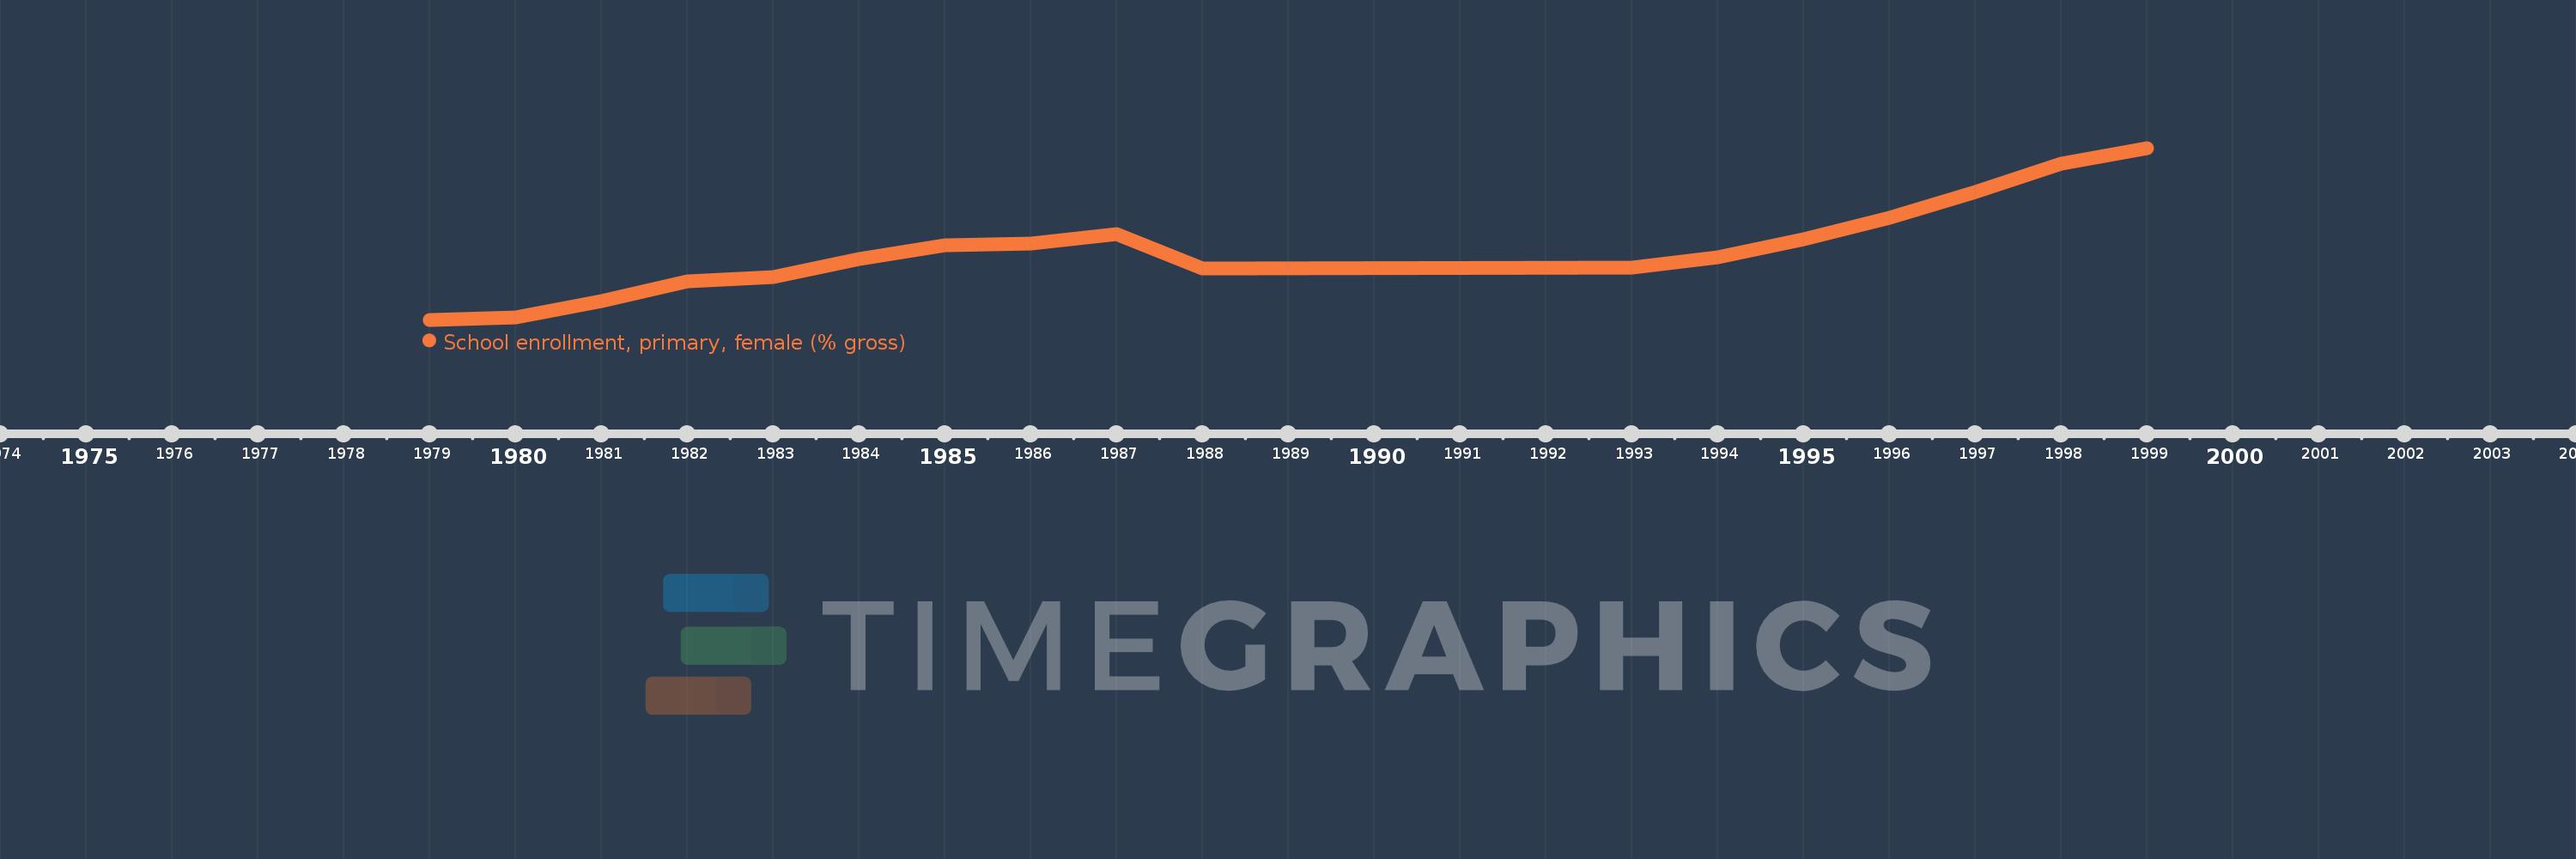
Questa scala temporale mostra un grafico dal 1979 anno al 1999 anno. Haiti. I dati fino ad 1978 anno non disponibili. Il numero di osservazioni attuali secondo i date: 17.
La fonte (nome):
Indicatori dello sviluppo mondiale
La fonte (organizzazione):
United Nations Educational, Scientific, and Cultural Organization (UNESCO) Institute for Statistics.
Categorie:
Education, Gender
sono stati aggiornati
23 apr 2017 anni
Indicatori delle variazioni dei valori per anni
In media:
79.052
Minima:
56.882
1 gen 1979 anni
Massimo:
110.755
1 gen 1999 anni
Alla data di osservazione
Valore
Variazione assoluta
La variazione rispetto al valore precedente
1 gen 1979 anni
56.882
+56.882
0.0%
1 gen 1980 anni
57.622
+0.74
1.3%
1 gen 1981 anni
62.771
+5.149
8.94%
1 gen 1982 anni
68.977
+6.206
9.89%
1 gen 1983 anni
70.144
+1.167
1.69%
1 gen 1984 anni
76.017
+5.873
8.37%
1 gen 1985 anni
80.308
+4.291
5.64%
1 gen 1986 anni
80.703
+0.396
0.49%
1 gen 1987 anni
83.818
+3.115
3.86%
1 gen 1988 anni
72.928
-10.891
-12.99%
1 gen 1993 anni
73.11
+0.182
0.25%
1 gen 1994 anni
76.396
+3.286
4.49%
1 gen 1995 anni
82.023
+5.628
7.37%
1 gen 1996 anni
88.826
+6.803
8.29%
1 gen 1997 anni
96.838
+8.012
9.02%
1 gen 1998 anni
105.764
+8.926
9.22%
1 gen 1999 anni
110.755
+4.991
4.72%
Classificazione dei paesi secondo i statistiche attuali per anni