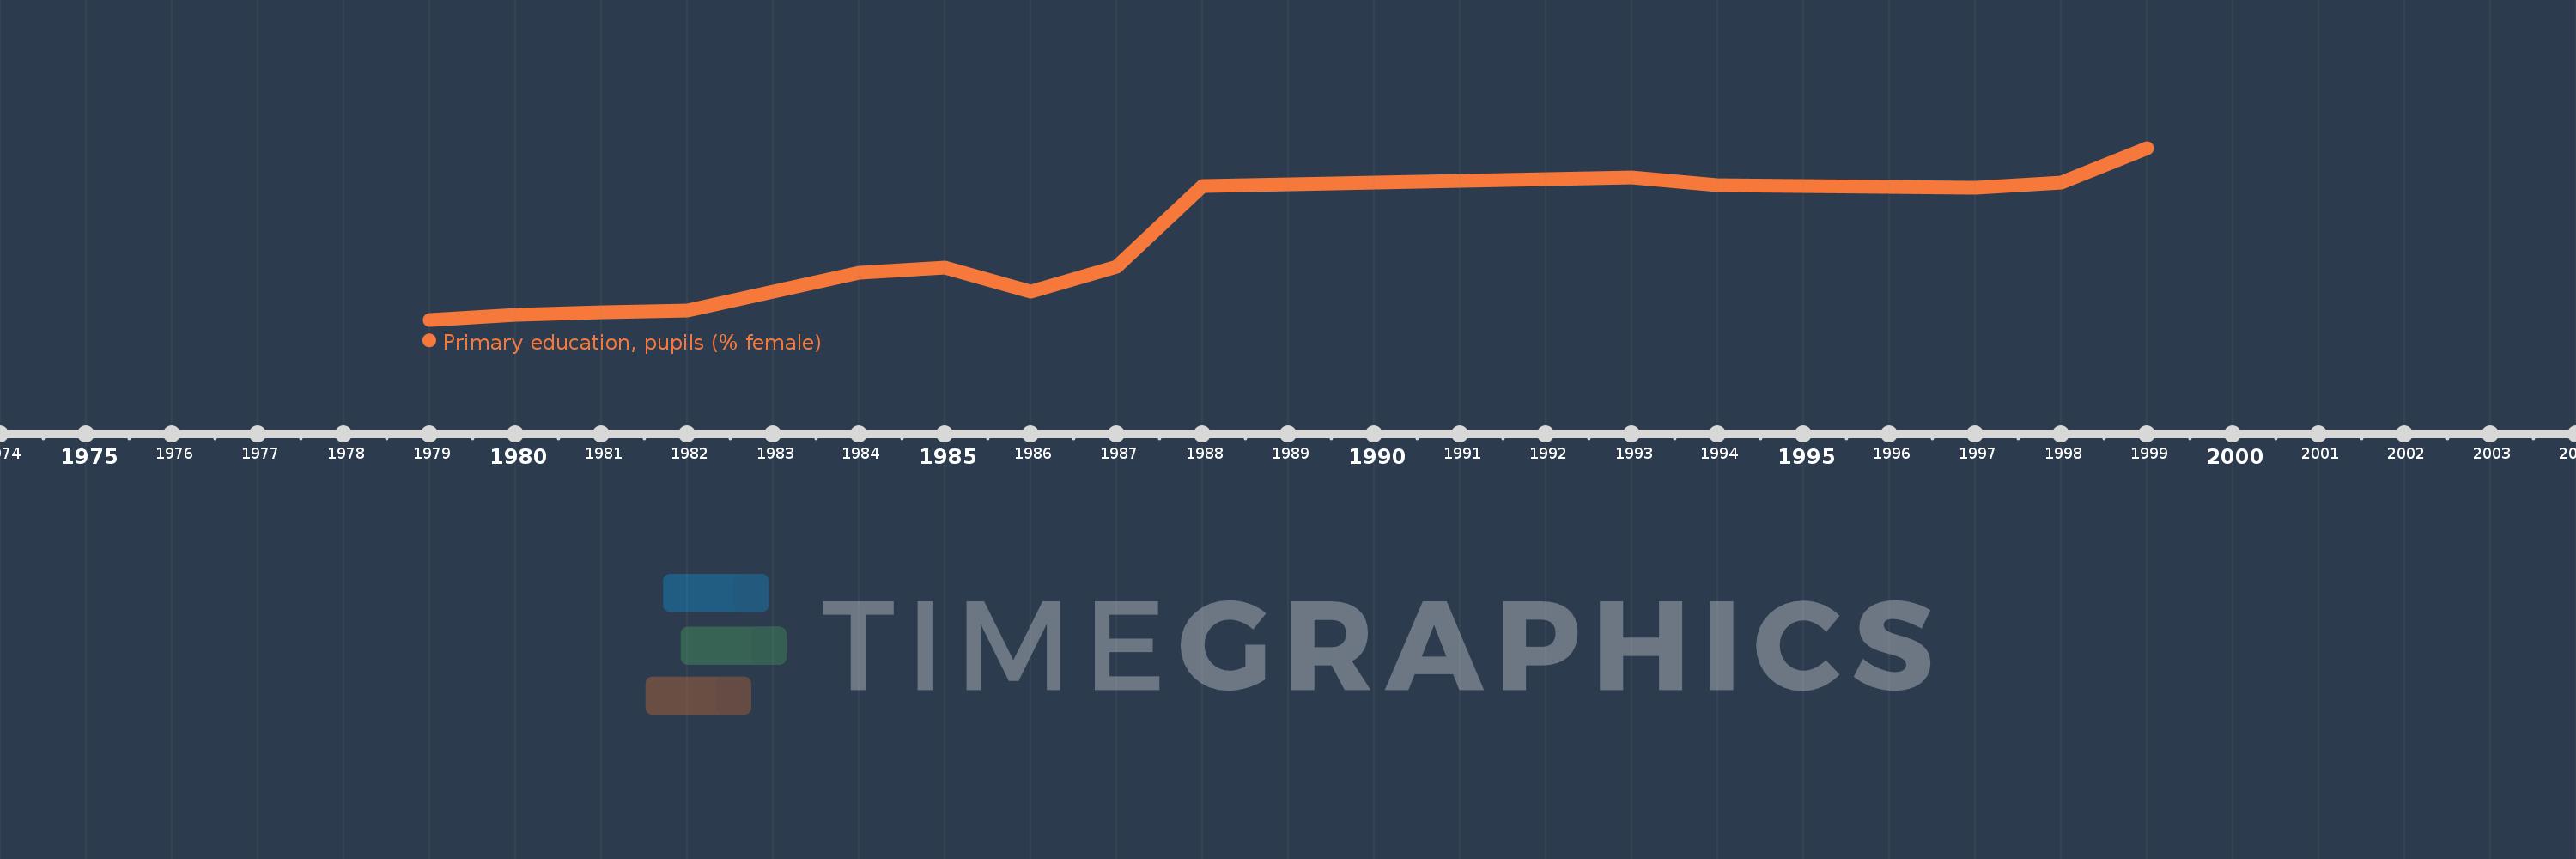
Questa scala temporale mostra un grafico dal 1979 anno al 1999 anno. Haiti. I dati fino ad 1978 anno non disponibili. Il numero di osservazioni attuali secondo i date: 17.
La fonte (nome):
Indicatori dello sviluppo mondiale
La fonte (organizzazione):
United Nations Educational, Scientific, and Cultural Organization (UNESCO) Institute for Statistics.
Categorie:
Education, Gender
sono stati aggiornati
23 apr 2017 anni
Indicatori delle variazioni dei valori per anni
In media:
47.108
Minima:
45.718
1 gen 1979 anni
Massimo:
48.733
1 gen 1999 anni
Alla data di osservazione
Valore
Variazione assoluta
La variazione rispetto al valore precedente
1 gen 1979 anni
45.718
+45.718
0.0%
1 gen 1980 anni
45.802
+0.084
0.18%
1 gen 1981 anni
45.856
+0.054
0.12%
1 gen 1982 anni
45.877
+0.021
0.05%
1 gen 1983 anni
46.209
+0.332
0.72%
1 gen 1984 anni
46.549
+0.34
0.74%
1 gen 1985 anni
46.635
+0.087
0.19%
1 gen 1986 anni
46.21
-0.425
-0.91%
1 gen 1987 anni
46.648
+0.438
0.95%
1 gen 1988 anni
48.064
+1.417
3.04%
1 gen 1993 anni
48.215
+0.15
0.31%
1 gen 1994 anni
48.074
-0.141
-0.29%
1 gen 1995 anni
48.059
-0.015
-0.03%
1 gen 1996 anni
48.044
-0.015
-0.03%
1 gen 1997 anni
48.028
-0.016
-0.03%
1 gen 1998 anni
48.12
+0.092
0.19%
1 gen 1999 anni
48.733
+0.612
1.27%
Classificazione dei paesi secondo i statistiche attuali per anni