33
/it/
AIzaSyB4mHJ5NPEv-XzF7P6NDYXjlkCWaeKw5bc
November 30, 2025
148367
Guyana
GUY
true
2
1
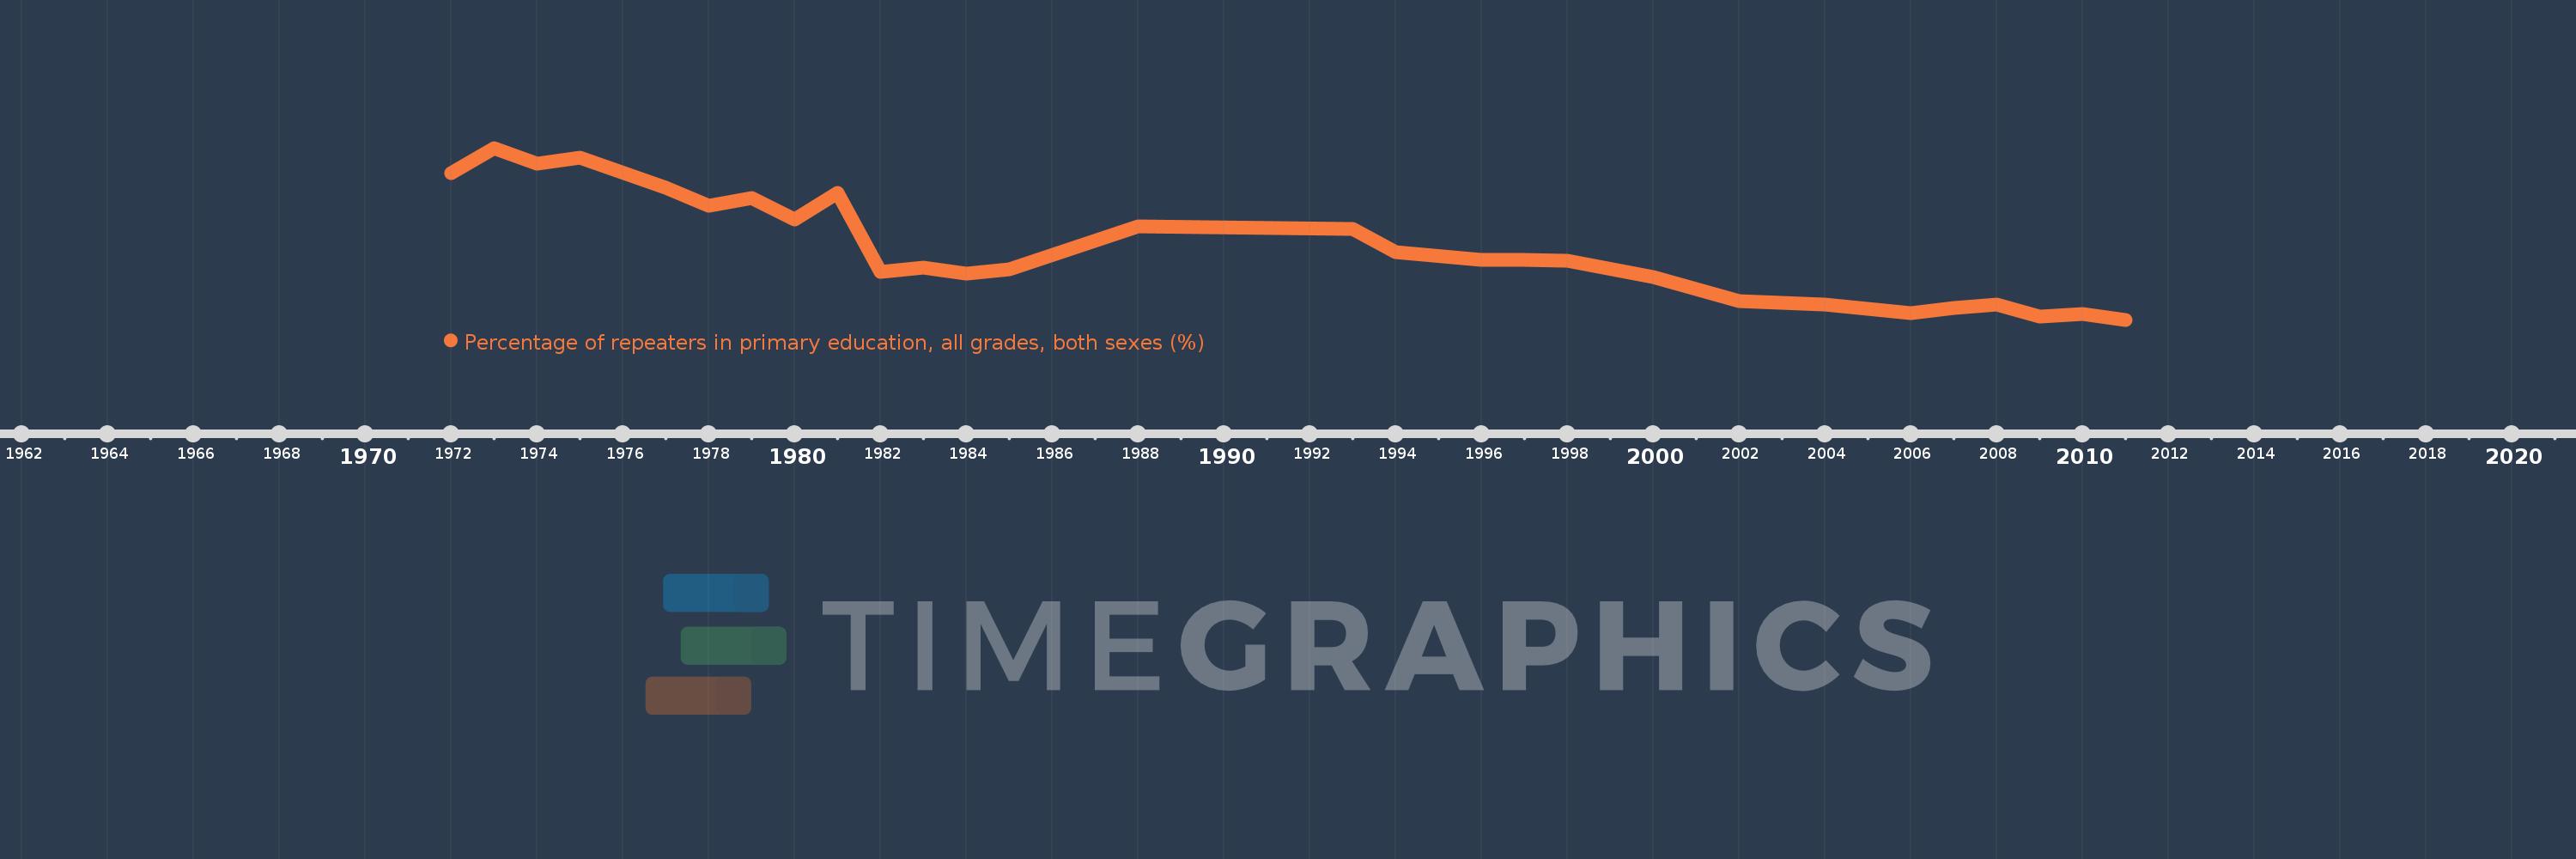
Percentage of repeaters in primary education, all grades, both sexes (%)
2011,2010,2009,2008,2007,2006,2004,2002,2001,2000,1998,1997,1996,1994,1993,1988,1985,1984,1983,1982,1981,1980,1979,1978,1977,1975,1974,1973,1972