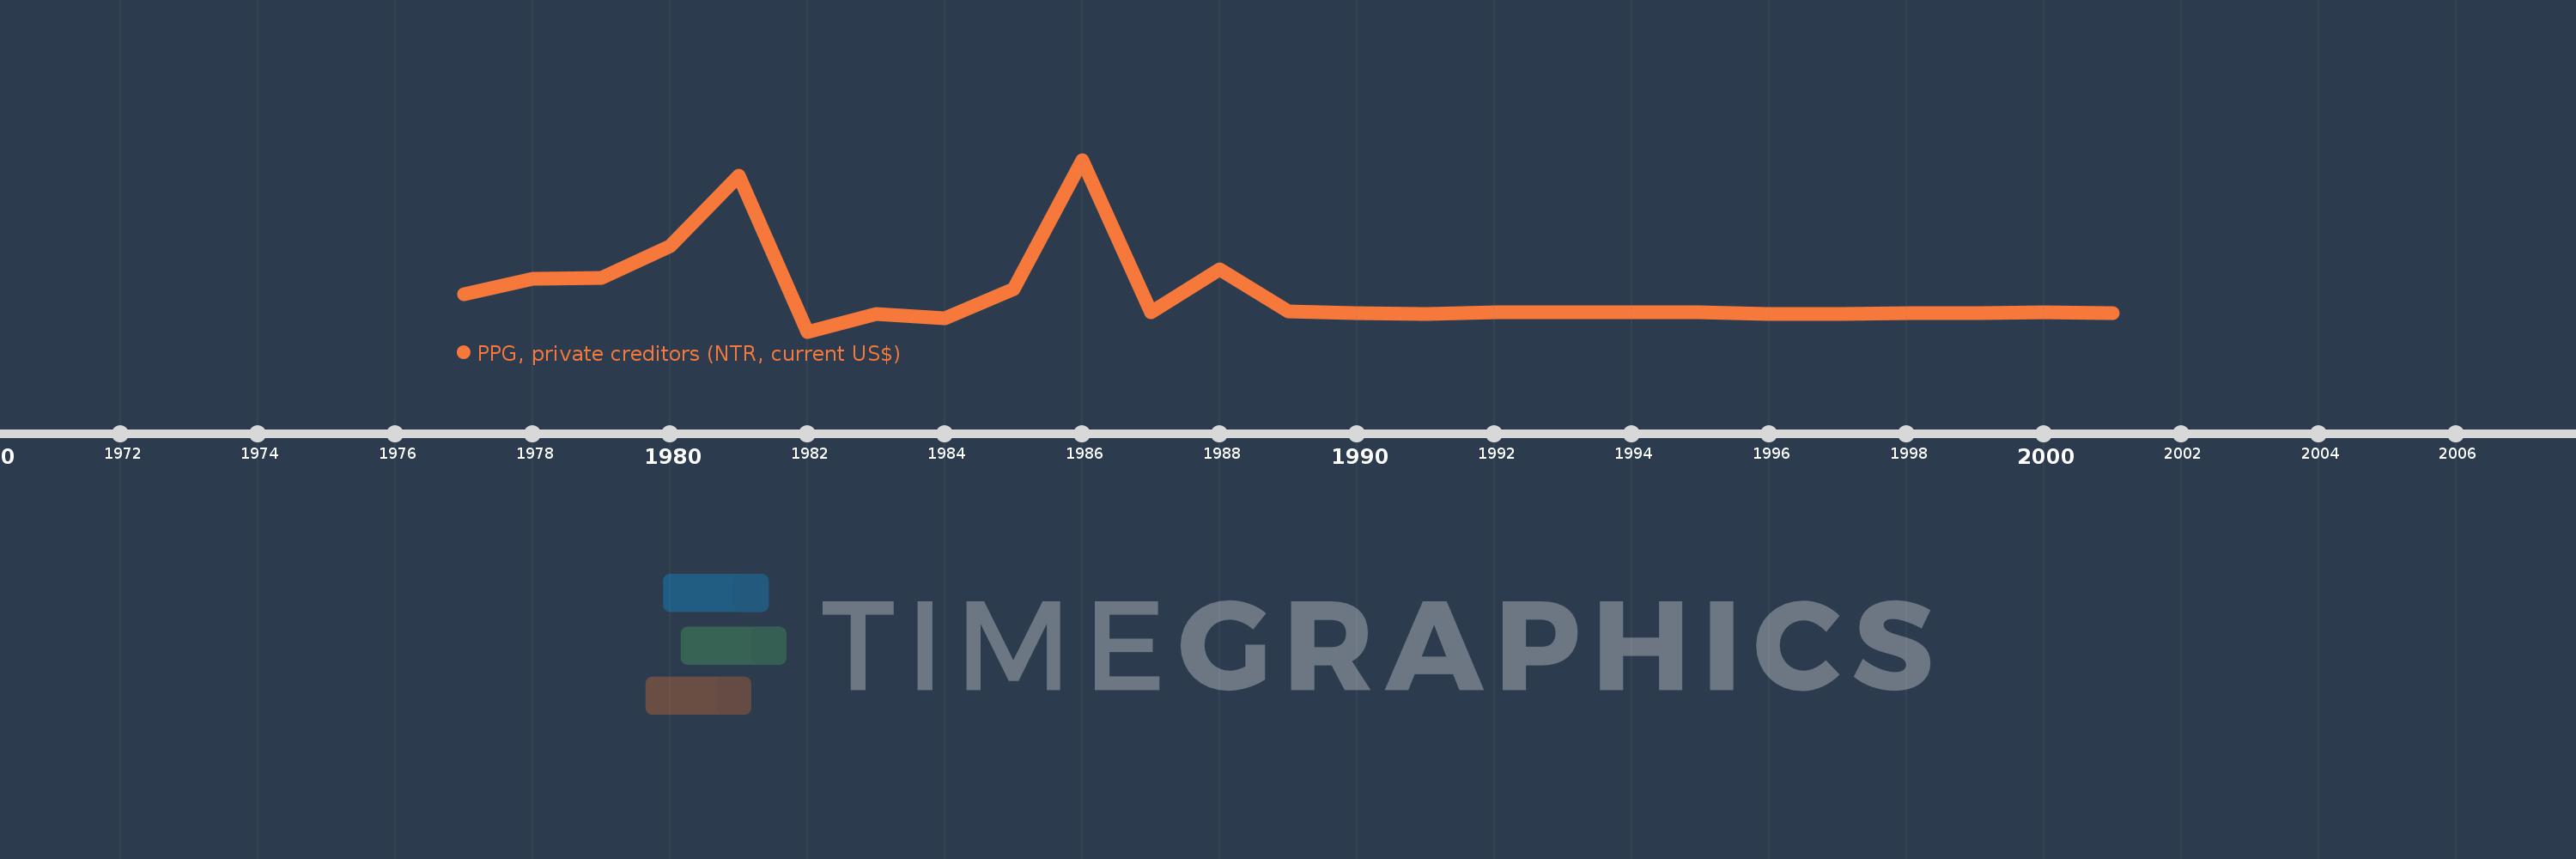
Questa scala temporale mostra un grafico dal 1977 anno al 2001 anno. Guinea-Bissau. I dati fino ad 1976 anno non disponibili. Il numero di osservazioni attuali secondo i date: 24.
La fonte (nome):
Indicatori dello sviluppo mondiale
La fonte (organizzazione):
World Bank, International Debt Statistics.
Categorie:
External Debt
sono stati aggiornati
23 apr 2017 anni
Indicatori delle variazioni dei valori per anni
In media:
2.354 Mln
Minima:
-2.53 Mln
1 gen 1982 anni
Massimo:
18.917 Mln
1 gen 1986 anni
Alla data di osservazione
Valore
Variazione assoluta
La variazione rispetto al valore precedente
1 gen 1977 anni
2.171 Mln
+2.171 Mln
0.0%
1 gen 1978 anni
4.079 Mln
+1.908 Mln
87.89%
1 gen 1979 anni
4.219 Mln
+140.0 Mille.
3.43%
1 gen 1980 anni
8.106 Mln
+3.887 Mln
92.13%
1 gen 1981 anni
16.945 Mln
+8.839 Mln
109.04%
1 gen 1982 anni
-2.53 Mln
-19.475 Mln
-114.93%
1 gen 1983 anni
-280.0 Mille.
+2.25 Mln
-88.93%
1 gen 1984 anni
-852.0 Mille.
-572.0 Mille.
204.29%
1 gen 1985 anni
2.754 Mln
+3.606 Mln
-423.24%
1 gen 1986 anni
18.917 Mln
+16.163 Mln
586.89%
1 gen 1987 anni
-146.0 Mille.
-19.063 Mln
-100.77%
1 gen 1988 anni
5.243 Mln
+5.389 Mln
-3.69 Mille.%
1 gen 1989 anni
-13.0 Mille.
-5.256 Mln
-100.25%
1 gen 1990 anni
-184.0 Mille.
-171.0 Mille.
1.32 Mille.%
1 gen 1991 anni
-345.0 Mille.
-161.0 Mille.
87.5%
1 gen 1992 anni
-149.0 Mille.
+196.0 Mille.
-56.81%
1 gen 1993 anni
-70.0 Mille.
+79.0 Mille.
-53.02%
1 gen 1995 anni
-75.0 Mille.
-5.0 Mille.
7.14%
1 gen 1996 anni
-287.0 Mille.
-212.0 Mille.
282.67%
1 gen 1997 anni
-289.0 Mille.
-2.0 Mille.
0.7%
1 gen 1998 anni
-179.0 Mille.
+110.0 Mille.
-38.06%
1 gen 1999 anni
-179.0 Mille.
0.0
0.0%
1 gen 2000 anni
-169.0 Mille.
+10.0 Mille.
-5.59%
1 gen 2001 anni
-188.0 Mille.
-19.0 Mille.
11.24%
Classificazione dei paesi secondo i statistiche attuali per anni