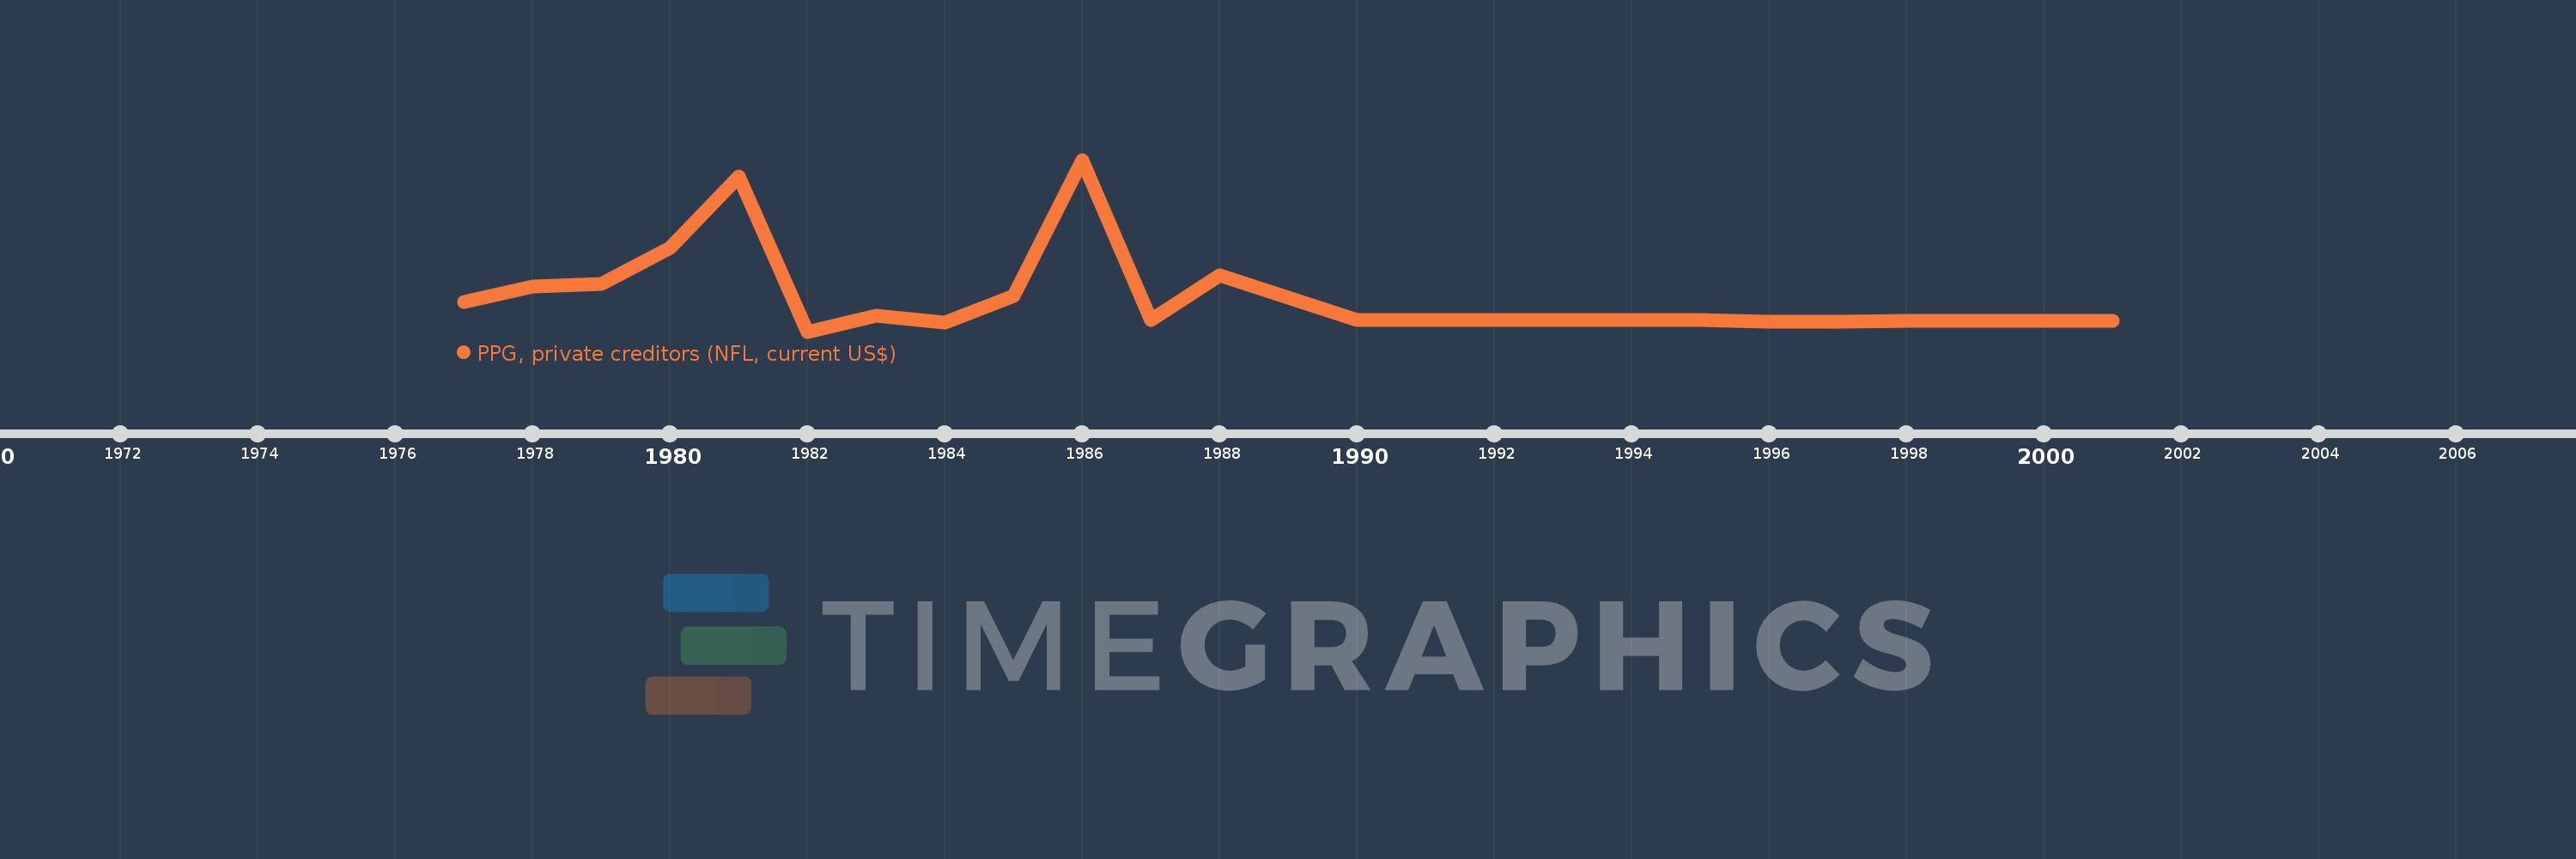
Questa scala temporale mostra un grafico dal 1977 anno al 2001 anno. Guinea-Bissau. I dati fino ad 1976 anno non disponibili. Il numero di osservazioni attuali secondo i date: 23.
La fonte (nome):
Indicatori dello sviluppo mondiale
La fonte (organizzazione):
World Bank, International Debt Statistics.
Categorie:
External Debt
sono stati aggiornati
23 apr 2017 anni
Indicatori delle variazioni dei valori per anni
In media:
2.724 Mln
Minima:
-1.513 Mln
1 gen 1982 anni
Massimo:
19.868 Mln
1 gen 1986 anni
Alla data di osservazione
Valore
Variazione assoluta
La variazione rispetto al valore precedente
1 gen 1977 anni
2.171 Mln
+2.171 Mln
0.0%
1 gen 1978 anni
4.079 Mln
+1.908 Mln
87.89%
1 gen 1979 anni
4.381 Mln
+302.0 Mille.
7.4%
1 gen 1980 anni
8.924 Mln
+4.543 Mln
103.7%
1 gen 1981 anni
17.756 Mln
+8.832 Mln
98.97%
1 gen 1982 anni
-1.513 Mln
-19.269 Mln
-108.52%
1 gen 1983 anni
452.0 Mille.
+1.965 Mln
-129.87%
1 gen 1984 anni
-403.0 Mille.
-855.0 Mille.
-189.16%
1 gen 1985 anni
2.947 Mln
+3.35 Mln
-831.27%
1 gen 1986 anni
19.868 Mln
+16.921 Mln
574.18%
1 gen 1987 anni
-122.0 Mille.
-19.99 Mln
-100.61%
1 gen 1988 anni
5.496 Mln
+5.618 Mln
-4.6 Mille.%
1 gen 1990 anni
-78.0 Mille.
-5.574 Mln
-101.42%
1 gen 1991 anni
-78.0 Mille.
0.0
0.0%
1 gen 1992 anni
-78.0 Mille.
0.0
0.0%
1 gen 1993 anni
-29.0 Mille.
+49.0 Mille.
-62.82%
1 gen 1995 anni
-75.0 Mille.
-46.0 Mille.
158.62%
1 gen 1996 anni
-254.0 Mille.
-179.0 Mille.
238.67%
1 gen 1997 anni
-233.0 Mille.
+21.0 Mille.
-8.27%
1 gen 1998 anni
-129.0 Mille.
+104.0 Mille.
-44.64%
1 gen 1999 anni
-129.0 Mille.
0.0
0.0%
1 gen 2000 anni
-129.0 Mille.
0.0
0.0%
1 gen 2001 anni
-178.0 Mille.
-49.0 Mille.
37.98%
Classificazione dei paesi secondo i statistiche attuali per anni