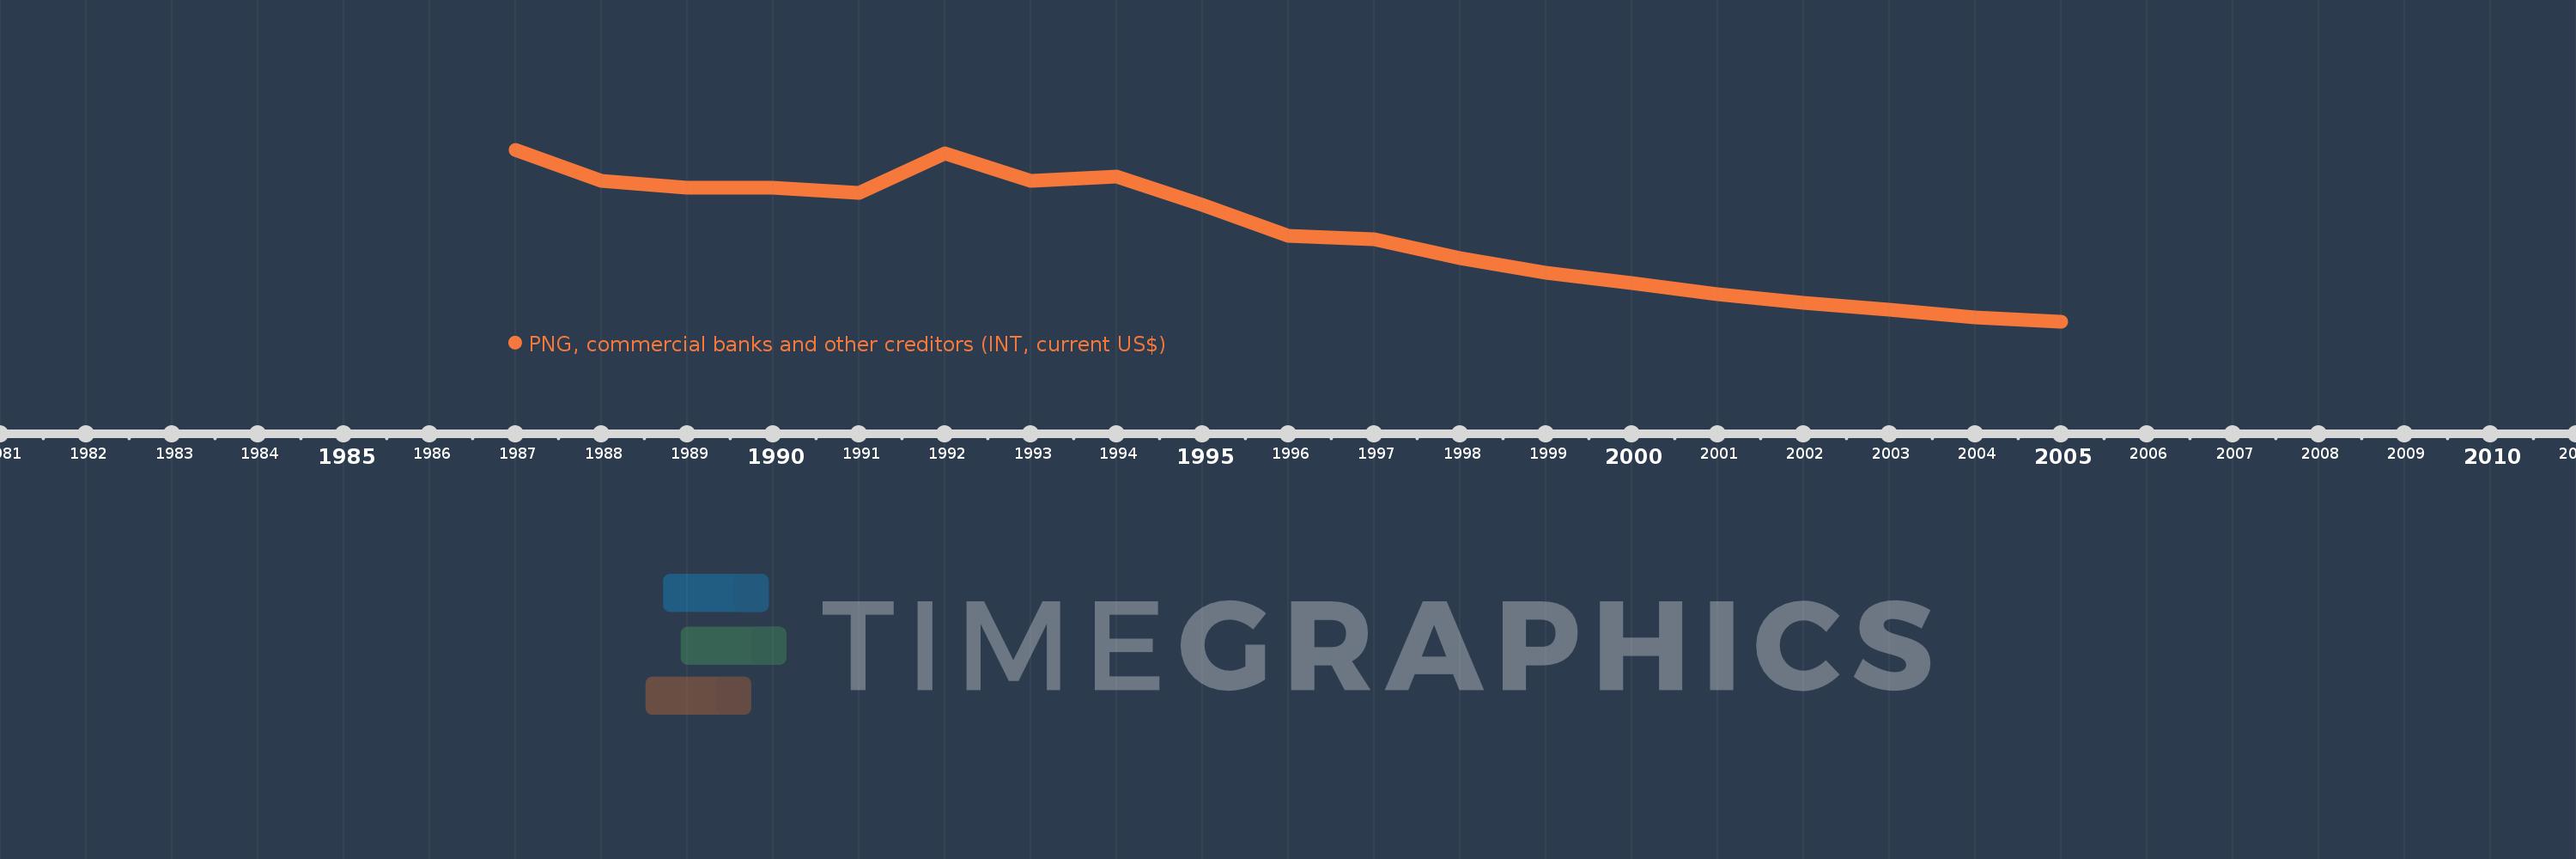
Questa scala temporale mostra un grafico dal 1987 anno al 2005 anno. Ghana. I dati fino ad 1986 anno non disponibili. Il numero di osservazioni attuali secondo i date: 19.
La fonte (nome):
Indicatori dello sviluppo mondiale
La fonte (organizzazione):
World Bank, International Debt Statistics.
Categorie:
External Debt
sono stati aggiornati
23 apr 2017 anni
Indicatori delle variazioni dei valori per anni
In media:
1.526 Mln
Minima:
90.0 Mille.
1 gen 2005 anni
Massimo:
2.9 Mln
1 gen 1987 anni
Alla data di osservazione
Valore
Variazione assoluta
La variazione rispetto al valore precedente
1 gen 1987 anni
2.9 Mln
+2.9 Mln
0.0%
1 gen 1988 anni
2.4 Mln
-500.0 Mille.
-17.24%
1 gen 1989 anni
2.28 Mln
-120.0 Mille.
-5.0%
1 gen 1990 anni
2.29 Mln
+10.0 Mille.
0.44%
1 gen 1991 anni
2.2 Mln
-90.0 Mille.
-3.93%
1 gen 1992 anni
2.847 Mln
+647.0 Mille.
29.41%
1 gen 1993 anni
2.4 Mln
-447.0 Mille.
-15.7%
1 gen 1994 anni
2.465 Mln
+65.0 Mille.
2.71%
1 gen 1995 anni
2.0 Mln
-465.0 Mille.
-18.86%
1 gen 1996 anni
1.5 Mln
-500.0 Mille.
-25.0%
1 gen 1997 anni
1.44 Mln
-60.0 Mille.
-4.0%
1 gen 1998 anni
1.13 Mln
-310.0 Mille.
-21.53%
1 gen 1999 anni
900.0 Mille.
-230.0 Mille.
-20.35%
1 gen 2000 anni
730.0 Mille.
-170.0 Mille.
-18.89%
1 gen 2001 anni
550.0 Mille.
-180.0 Mille.
-24.66%
1 gen 2002 anni
410.0 Mille.
-140.0 Mille.
-25.45%
1 gen 2003 anni
290.0 Mille.
-120.0 Mille.
-29.27%
1 gen 2004 anni
170.0 Mille.
-120.0 Mille.
-41.38%
1 gen 2005 anni
90.0 Mille.
-80.0 Mille.
-47.06%
Classificazione dei paesi secondo i statistiche attuali per anni