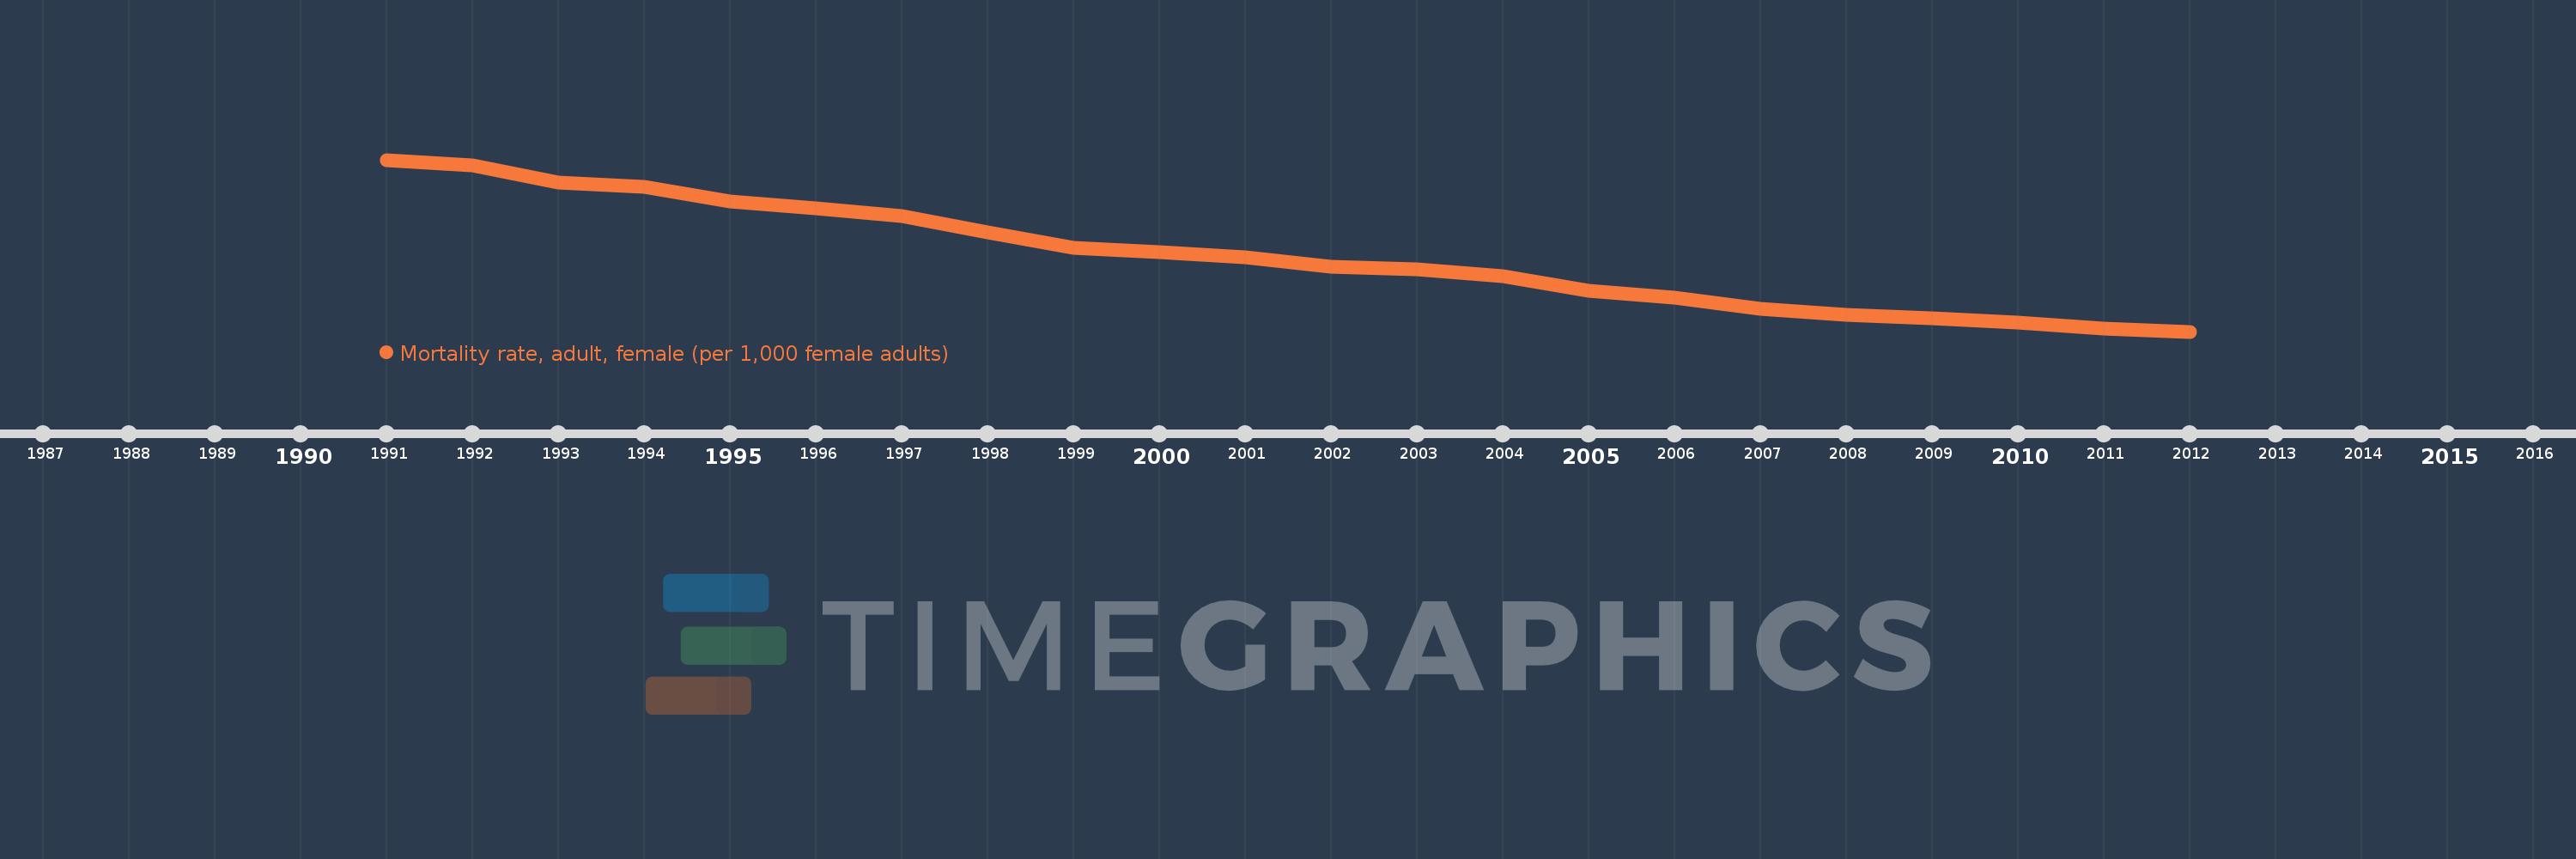
Questa scala temporale mostra un grafico dal 1991 anno al 2012 anno. Germany. I dati fino ad 1990 anno non disponibili. Il numero di osservazioni attuali secondo i date: 22.
La fonte (nome):
Indicatori dello sviluppo mondiale
La fonte (organizzazione):
(1) United Nations Population Division. World Population Prospects. New York, United Nations, Department of Economic and Social Affairs (advanced Excel tables). Available at http://esa.un.org/wpp/unpp/panel_population.htm, (2) University of California, Berkeley, and Max Planck Institute for Demographic Research. Human Mortality Database. [ www.mortality.org or www.humanmortality.de].
Categorie:
Health, Gender
sono stati aggiornati
23 apr 2017 anni
Indicatori delle variazioni dei valori per anni
In media:
63.174
Minima:
52.326
1 gen 2012 anni
Massimo:
77.04
1 gen 1991 anni
Alla data di osservazione
Valore
Variazione assoluta
La variazione rispetto al valore precedente
1 gen 1991 anni
77.04
+77.04
0.0%
1 gen 1992 anni
76.252
-0.788
-1.02%
1 gen 1993 anni
73.721
-2.531
-3.32%
1 gen 1994 anni
73.17
-0.551
-0.75%
1 gen 1995 anni
71.047
-2.123
-2.9%
1 gen 1996 anni
70.112
-0.935
-1.32%
1 gen 1997 anni
68.903
-1.209
-1.72%
1 gen 1998 anni
66.606
-2.297
-3.33%
1 gen 1999 anni
64.381
-2.225
-3.34%
1 gen 2000 anni
63.781
-0.6
-0.93%
1 gen 2001 anni
62.971
-0.81
-1.27%
1 gen 2002 anni
61.667
-1.304
-2.07%
1 gen 2003 anni
61.292
-0.375
-0.61%
1 gen 2004 anni
60.254
-1.038
-1.69%
1 gen 2005 anni
58.163
-2.091
-3.47%
1 gen 2006 anni
57.197
-0.966
-1.66%
1 gen 2007 anni
55.645
-1.552
-2.71%
1 gen 2008 anni
54.73
-0.915
-1.64%
1 gen 2009 anni
54.204
-0.526
-0.96%
1 gen 2010 anni
53.674
-0.53
-0.98%
1 gen 2011 anni
52.701
-0.973
-1.81%
1 gen 2012 anni
52.326
-0.375
-0.71%
Classificazione dei paesi secondo i statistiche attuali per anni