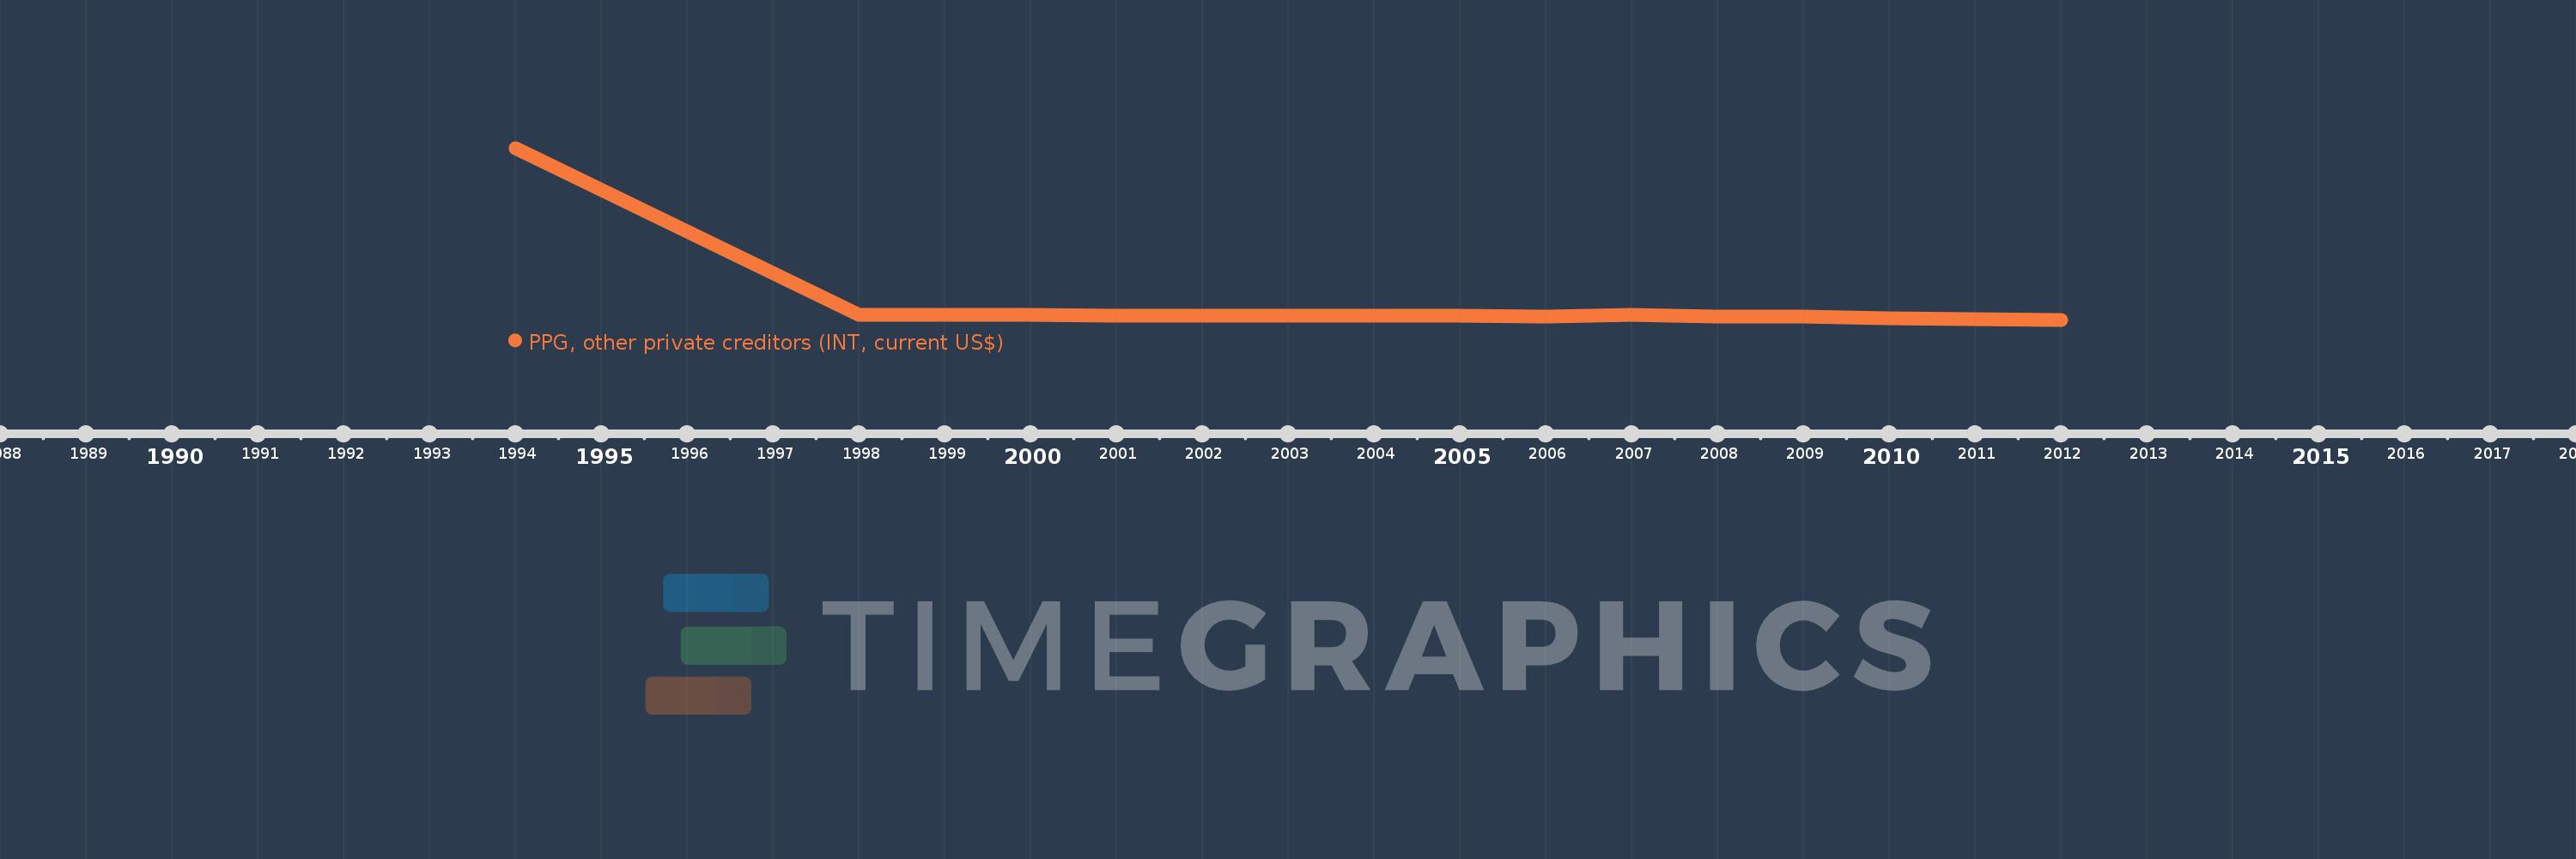
Questa scala temporale mostra un grafico dal 1994 anno al 2012 anno. Georgia. I dati fino ad 1993 anno non disponibili. Il numero di osservazioni attuali secondo i date: 16.
La fonte (nome):
Indicatori dello sviluppo mondiale
La fonte (organizzazione):
World Bank, International Debt Statistics.
Categorie:
External Debt
sono stati aggiornati
23 apr 2017 anni
Indicatori delle variazioni dei valori per anni
In media:
294.75 Mille.
Minima:
14.0 Mille.
1 gen 2012 anni
Massimo:
3.491 Mln
1 gen 1994 anni
Alla data di osservazione
Valore
Variazione assoluta
La variazione rispetto al valore precedente
1 gen 1994 anni
3.491 Mln
+3.491 Mln
0.0%
1 gen 1998 anni
107.0 Mille.
-3.384 Mln
-96.93%
1 gen 1999 anni
108.0 Mille.
+1000.0
0.93%
1 gen 2000 anni
105.0 Mille.
-3.0 Mille.
-2.78%
1 gen 2001 anni
90.0 Mille.
-15.0 Mille.
-14.29%
1 gen 2002 anni
88.0 Mille.
-2.0 Mille.
-2.22%
1 gen 2003 anni
89.0 Mille.
+1000.0
1.14%
1 gen 2004 anni
101.0 Mille.
+12.0 Mille.
13.48%
1 gen 2005 anni
103.0 Mille.
+2.0 Mille.
1.98%
1 gen 2006 anni
71.0 Mille.
-32.0 Mille.
-31.07%
1 gen 2007 anni
109.0 Mille.
+38.0 Mille.
53.52%
1 gen 2008 anni
79.0 Mille.
-30.0 Mille.
-27.52%
1 gen 2009 anni
77.0 Mille.
-2.0 Mille.
-2.53%
1 gen 2010 anni
52.0 Mille.
-25.0 Mille.
-32.47%
1 gen 2011 anni
32.0 Mille.
-20.0 Mille.
-38.46%
1 gen 2012 anni
14.0 Mille.
-18.0 Mille.
-56.25%
Classificazione dei paesi secondo i statistiche attuali per anni