33
/it/
AIzaSyAYiBZKx7MnpbEhh9jyipgxe19OcubqV5w
August 1, 2025
138359
Georgia
GEO
true
2
1
Net bilateral aid flows from DAC donors, Belgium (current US$)
2013,2011,2010,2009,2008,2007,2006,2005,2004,2003,2002,2001,2000,1996,1995
Download
Biblioteca di statistiche globali →Georgia →

Net bilateral aid flows from DAC donors, Belgium (current US$)

Queste statistiche in altri paesi:

AfghanistanAlbaniaAlgeriaAngolaAntigua and BarbudaArab WorldArgentinaArmeniaArubaAzerbaijanBahamas, TheBahrainBangladeshBarbadosBelarusBelizeBeninBhutanBoliviaBosnia and HerzegovinaBotswanaBrazilBritish Virgin IslandsBulgariaBurkina FasoBurundiCabo VerdeCambodiaCameroonCaribbean small statesCentral African RepublicCentral Europe and the BalticsChadChileChinaColombiaComorosCongo, Dem. Rep.Congo, Rep.Costa RicaCote d'IvoireCroatiaCubaCyprusCzech RepublicDjiboutiDominicaDominican RepublicEast Asia & PacificEast Asia & Pacific (excluding high income)East Asia & Pacific (IDA & IBRD countries)EcuadorEgypt, Arab Rep.El SalvadorEquatorial GuineaEritreaEstoniaEthiopiaEuro areaEurope & Central AsiaEurope & Central Asia (excluding high income)Europe & Central Asia (IDA & IBRD countries)European UnionFijiFragile and conflict affected situationsGabonGambia, TheGeorgiaGhanaGrenadaGuatemalaGuineaGuinea-BissauGuyanaHaitiHeavily indebted poor countries (HIPC)High incomeHondurasHong Kong SAR, ChinaHungaryIBRD onlyIDA & IBRD totalIDA blendIDA onlyIDA totalIndiaIndonesiaIran, Islamic Rep.IraqIsraelJamaicaJordanKazakhstanKenyaKorea, Dem. People’s Rep.Korea, Rep.KosovoKuwaitKyrgyz RepublicLao PDRLatin America & Caribbean Latin America & Caribbean (excluding high income)Latin America & the Caribbean (IDA & IBRD countries)LatviaLeast developed countries: UN classificationLebanonLesothoLiberiaLibyaLithuaniaLow & middle incomeLow incomeLower middle incomeMacedonia, FYRMadagascarMalawiMalaysiaMaldivesMaliMaltaMarshall IslandsMauritaniaMauritiusMexicoMiddle East & North AfricaMiddle East & North Africa (excluding high income)Middle East & North Africa (IDA & IBRD countries)Middle incomeMoldovaMongoliaMontenegroMoroccoMozambiqueMyanmarNamibiaNepalNew CaledoniaNicaraguaNigerNigeriaNorthern Mariana IslandsOECD membersOmanOther small statesPacific island small statesPakistanPanamaPapua New GuineaParaguayPeruPhilippinesPolandRomaniaRussian FederationRwandaSamoaSao Tome and PrincipeSaudi ArabiaSenegalSerbiaSeychellesSierra LeoneSingaporeSlovak RepublicSloveniaSmall statesSolomon IslandsSomaliaSouth AfricaSouth AsiaSouth Asia (IDA & IBRD)South SudanSri LankaSt. LuciaSt. Vincent and the GrenadinesSub-Saharan Africa Sub-Saharan Africa (excluding high income)Sub-Saharan Africa (IDA & IBRD countries)SudanSurinameSwazilandSyrian Arab RepublicTajikistanTanzaniaThailandTimor-LesteTogoTongaTrinidad and TobagoTunisiaTurkeyTurkmenistanUgandaUkraineUnited Arab EmiratesUpper middle incomeUruguayUzbekistanVanuatuVenezuela, RBVietnamWest Bank and GazaWorldYemen, Rep.ZambiaZimbabwe

Linea del tempo:

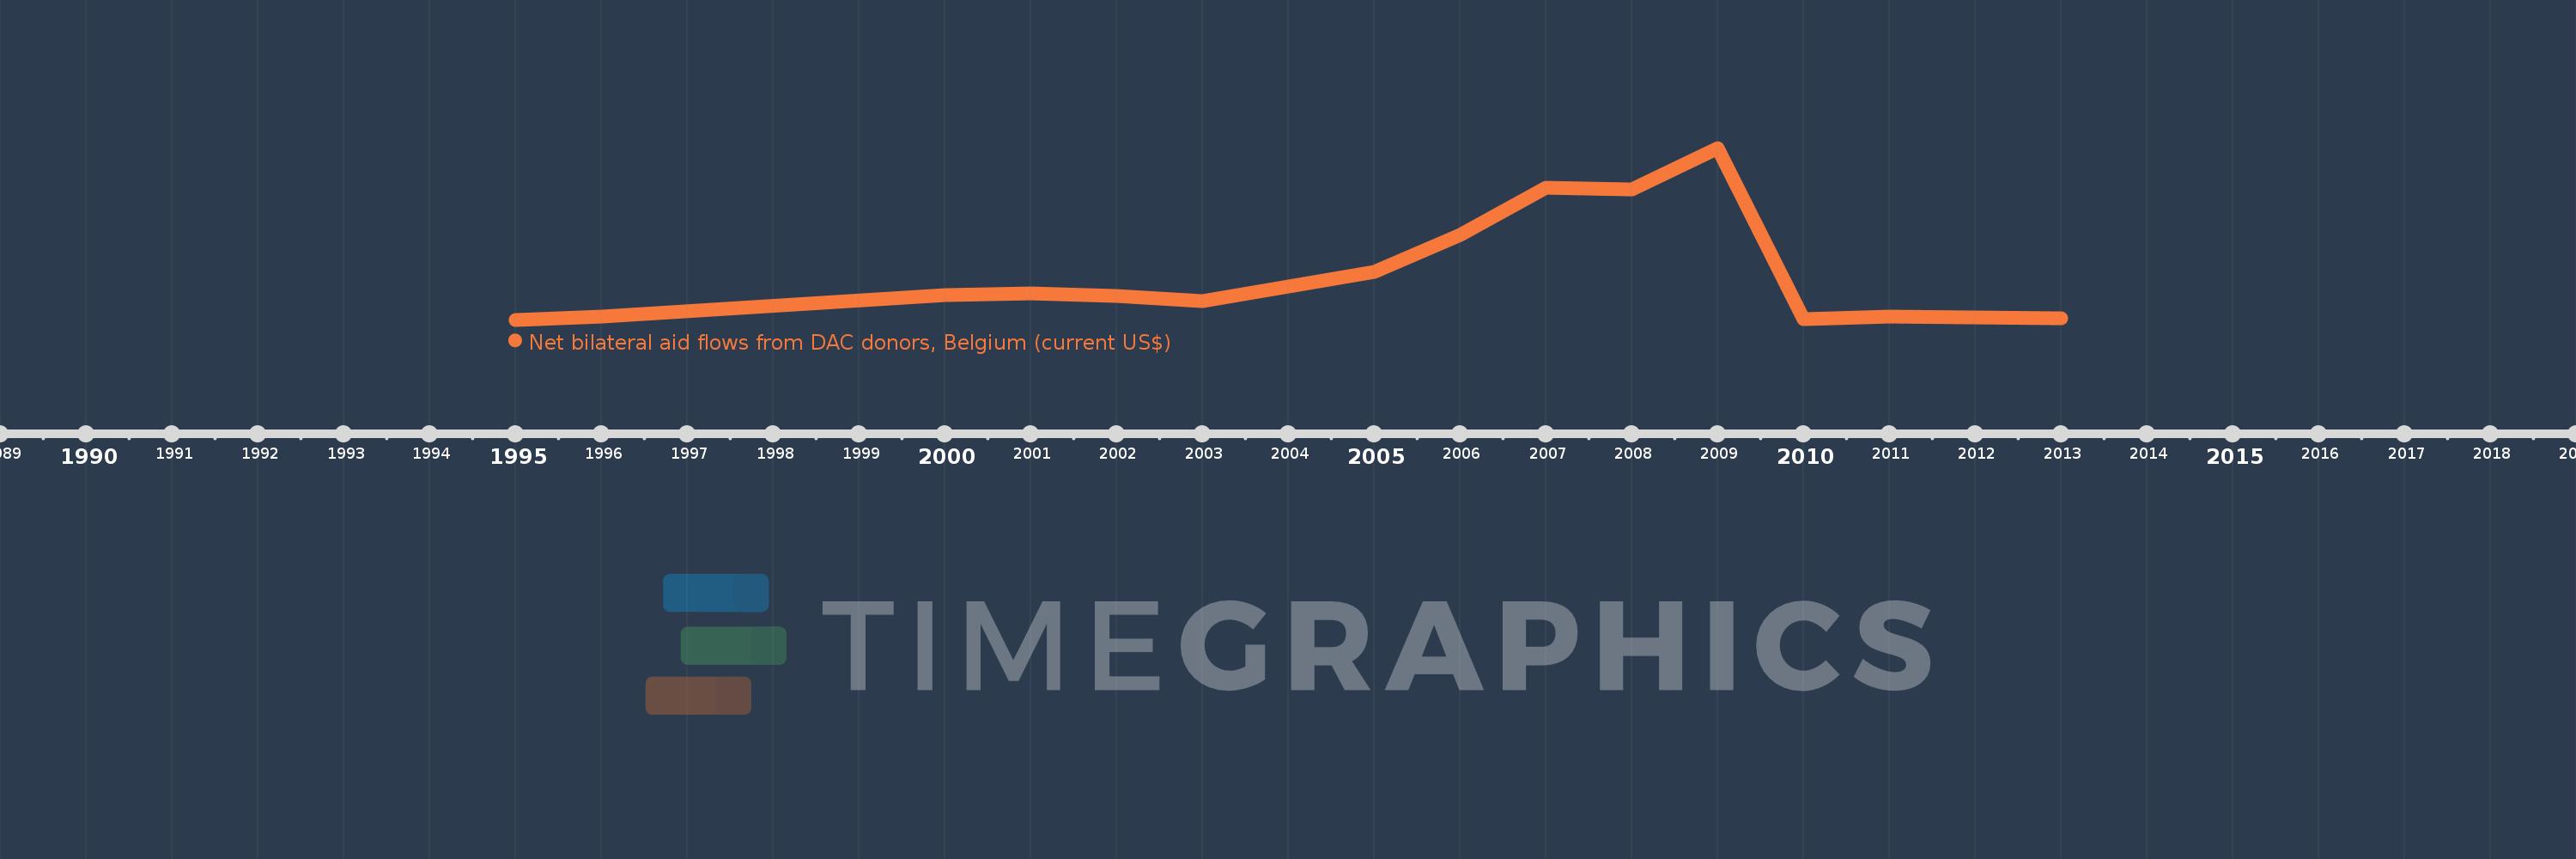
Questa scala temporale mostra un grafico dal 1995 anno al 2013 anno. Georgia. I dati fino ad 1994 anno non disponibili. Il numero di osservazioni attuali secondo i date: 15.

La fonte (nome):

Indicatori dello sviluppo mondiale

La fonte (organizzazione):

Development Assistance Committee of the Organisation for Economic Co-operation and Development, Geographical Distribution of Financial Flows to Developing Countries, Development Co-operation Report, and International Development Statistics database. Data are available online at: www.oecd.org/dac/stats/idsonline.

Categorie:

Aid Effectiveness

sono stati aggiornati

23 apr 2017 anni

Indicatori delle variazioni dei valori per anni

In media:
548.667 Mille.
Minima:
10.0 Mille.
1 gen 1995 anni
Massimo:
1.99 Mln
1 gen 2009 anni
Alla data di osservazione
Valore
Variazione assoluta
La variazione rispetto al valore precedente
1 gen 1995 anni
10.0 Mille.
+10.0 Mille.
0.0%
1 gen 1996 anni
50.0 Mille.
+40.0 Mille.
400.0%
1 gen 2000 anni
290.0 Mille.
+240.0 Mille.
480.0%
1 gen 2001 anni
310.0 Mille.
+20.0 Mille.
6.9%
1 gen 2002 anni
280.0 Mille.
-30.0 Mille.
-9.68%
1 gen 2003 anni
220.0 Mille.
-60.0 Mille.
-21.43%
1 gen 2004 anni
390.0 Mille.
+170.0 Mille.
77.27%
1 gen 2005 anni
560.0 Mille.
+170.0 Mille.
43.59%
1 gen 2006 anni
990.0 Mille.
+430.0 Mille.
76.79%
1 gen 2007 anni
1.53 Mln
+540.0 Mille.
54.55%
1 gen 2008 anni
1.51 Mln
-20.0 Mille.
-1.31%
1 gen 2009 anni
1.99 Mln
+480.0 Mille.
31.79%
1 gen 2010 anni
20.0 Mille.
-1.97 Mln
-98.99%
1 gen 2011 anni
50.0 Mille.
+30.0 Mille.
150.0%
1 gen 2013 anni
30.0 Mille.
-20.0 Mille.
-40.0%

Classificazione dei paesi secondo i statistiche attuali per anni