29
/it/
it
AIzaSyAYiBZKx7MnpbEhh9jyipgxe19OcubqV5w
April 1, 2024
134044
France
FRA
true
2
1
Expenditure on primary as % of government expenditure on education (%)
2013,2012,2011,2010,2009,2008,2007,2006,2005,2004,2003,2002,2001,2000
Download
Biblioteca di statistiche globali →France →

Expenditure on primary as % of government expenditure on education (%)

Queste statistiche in altri paesi:
AlbaniaAndorraAngolaAntigua and BarbudaArgentinaArmeniaArubaAustraliaAustriaBangladeshBarbadosBelgiumBelizeBeninBermudaBhutanBoliviaBotswanaBrazilBritish Virgin IslandsBrunei DarussalamBulgariaBurkina FasoBurundiCabo VerdeCambodiaCameroonCaribbean small statesCayman IslandsCentral African RepublicCentral Europe and the BalticsChadChileChinaColombiaComorosCongo, Dem. Rep.Congo, Rep.Costa RicaCote d'IvoireCubaCuracaoCyprusCzech RepublicDenmarkDjiboutiDominicaDominican RepublicEast Asia & PacificEast Asia & Pacific (IDA & IBRD countries)EcuadorEl SalvadorEquatorial GuineaEritreaEstoniaEthiopiaEuro areaEurope & Central AsiaEuropean UnionFijiFinlandFranceGabonGambia, TheGeorgiaGermanyGhanaGrenadaGuatemalaGuineaGuinea-BissauGuyanaHeavily indebted poor countries (HIPC)High incomeHondurasHong Kong SAR, ChinaHungaryIcelandIDA blendIDA totalIndiaIndonesiaIran, Islamic Rep.IrelandIsraelItalyJamaicaJapanJordanKenyaKiribatiKorea, Rep.KuwaitLao PDRLate-demographic dividendLatin America & Caribbean Latin America & Caribbean (excluding high income)Latin America & the Caribbean (IDA & IBRD countries)LatviaLeast developed countries: UN classificationLesothoLiberiaLiechtensteinLithuaniaLow incomeMacao SAR, ChinaMadagascarMalawiMalaysiaMaldivesMaliMaltaMarshall IslandsMauritaniaMauritiusMexicoMoldovaMonacoMongoliaMoroccoMozambiqueNamibiaNauruNepalNetherlandsNew ZealandNicaraguaNigerNorth AmericaNorwayOECD membersOmanOther small statesPakistanPalauPanamaParaguayPeruPhilippinesPolandPortugalPost-demographic dividendPre-demographic dividendPuerto RicoQatarRomaniaRwandaSamoaSan MarinoSao Tome and PrincipeSenegalSerbiaSeychellesSierra LeoneSingaporeSlovak RepublicSloveniaSmall statesSouth AfricaSouth AsiaSouth Asia (IDA & IBRD)South SudanSpainSri LankaSt. Kitts and NevisSt. LuciaSt. Vincent and the GrenadinesSub-Saharan Africa Sub-Saharan Africa (excluding high income)Sub-Saharan Africa (IDA & IBRD countries)SwazilandSwedenSwitzerlandSyrian Arab RepublicTanzaniaThailandTimor-LesteTogoTongaTrinidad and TobagoTunisiaTurks and Caicos IslandsUgandaUkraineUnited KingdomUnited StatesUruguayVanuatuVenezuela, RBVietnamWorldZambiaZimbabwe
Linea del tempo:
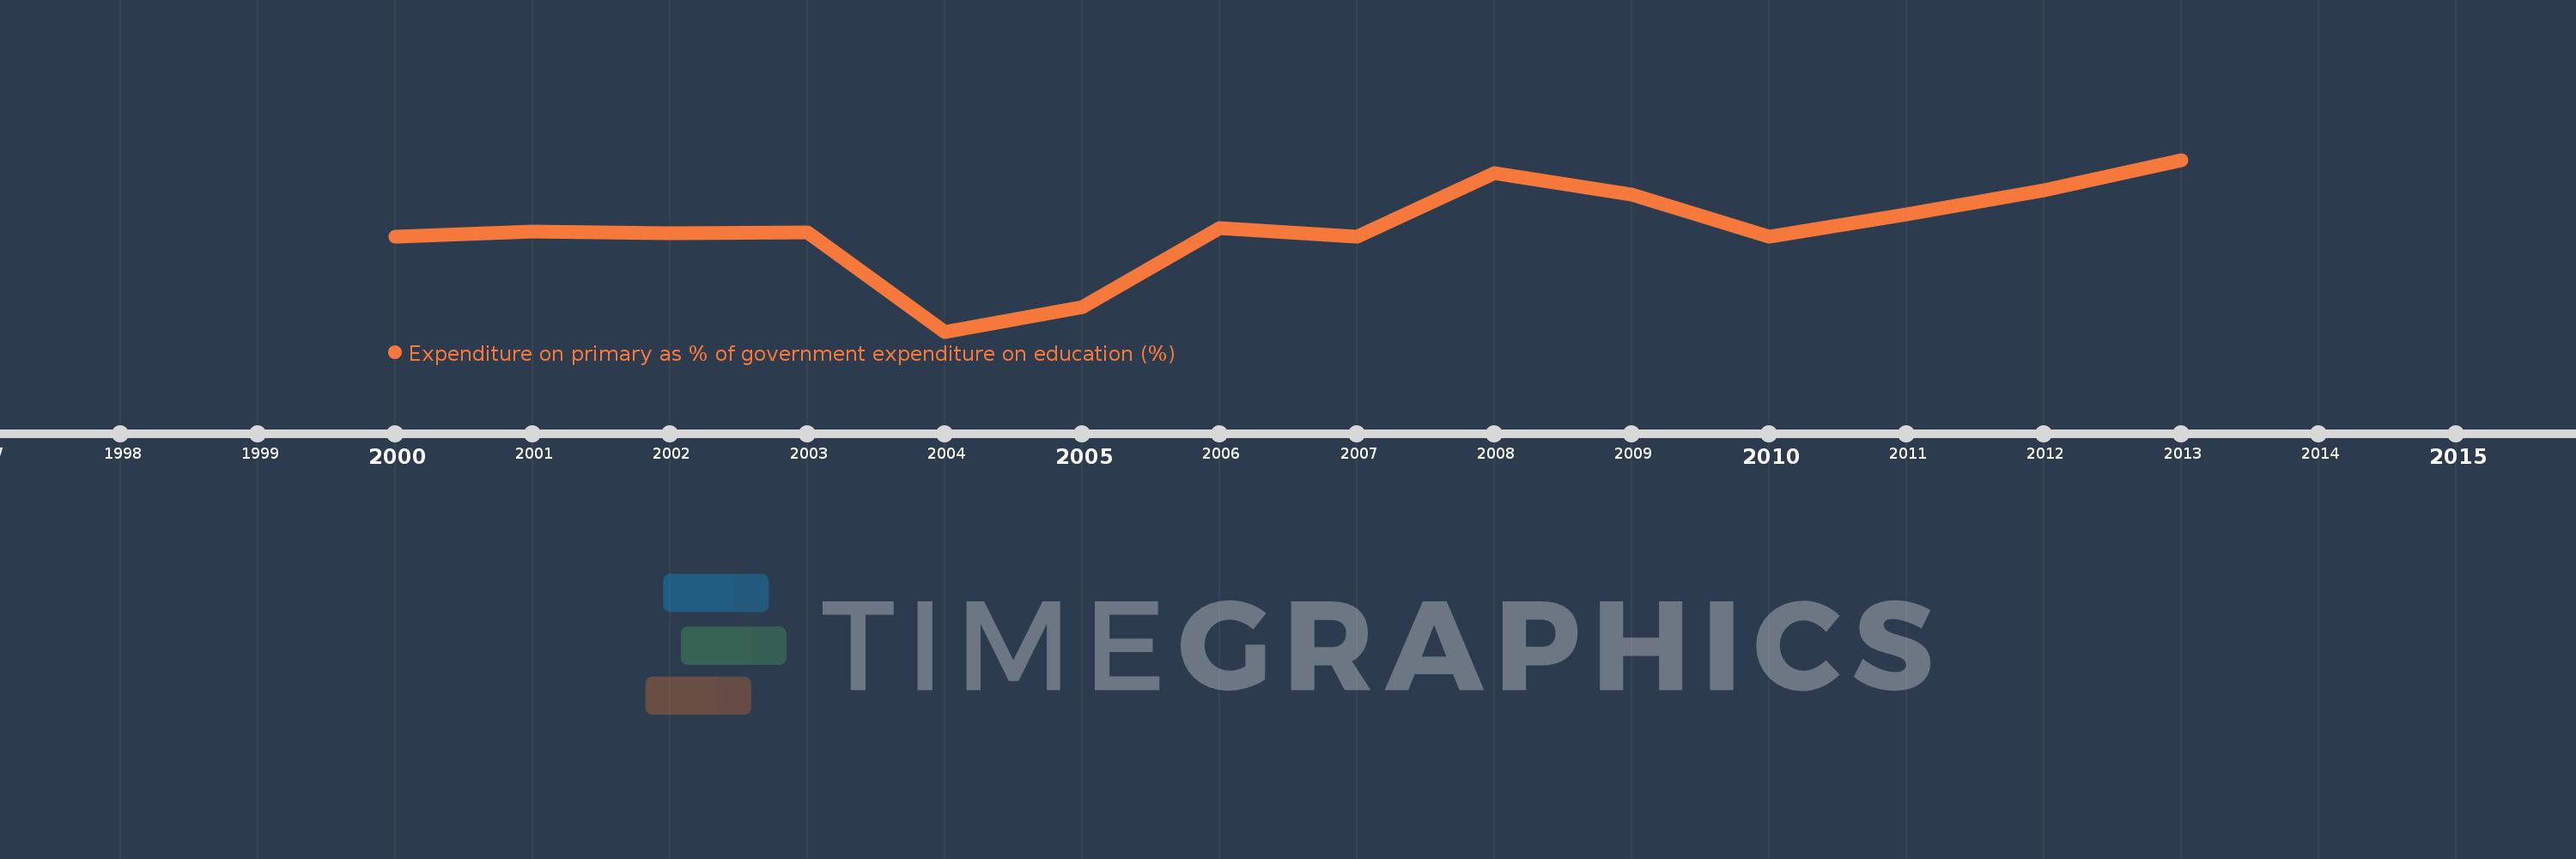
Questa scala temporale mostra un grafico dal 2000 anno al 2013 anno. France. I dati fino ad 1999 anno non disponibili. Il numero di osservazioni attuali secondo i date: 14.
La fonte (nome):
Indicatori dello sviluppo mondiale
La fonte (organizzazione):
UNESCO Institute for Statistics
Categorie:
Education
sono stati aggiornati
23 apr 2017 anni
Indicatori delle variazioni dei valori per anni
In media:
20.199
Minima:
18.809
1 gen 2004 anni
Massimo:
21.135
1 gen 2013 anni
Alla data di osservazione
Valore
Variazione assoluta
La variazione rispetto al valore precedente
1 gen 2000 anni
20.096
+20.096
0.0%
1 gen 2001 anni
20.169
+0.073
0.36%
1 gen 2002 anni
20.135
-0.034
-0.17%
1 gen 2003 anni
20.155
+0.02
0.1%
1 gen 2004 anni
18.809
-1.346
-6.68%
1 gen 2005 anni
19.14
+0.331
1.76%
1 gen 2006 anni
20.207
+1.068
5.58%
1 gen 2007 anni
20.094
-0.113
-0.56%
1 gen 2008 anni
20.959
+0.864
4.3%
1 gen 2009 anni
20.666
-0.292
-1.39%
1 gen 2010 anni
20.093
-0.574
-2.78%
1 gen 2011 anni
20.398
+0.305
1.52%
1 gen 2012 anni
20.723
+0.324
1.59%
1 gen 2013 anni
21.135
+0.413
1.99%
Classificazione dei paesi secondo i statistiche attuali per anni

Commenti:

Inviare
PremiumAbout & FeedbackAccordoPrivatezza
logo
© 2022 Selected Technologies LLC – Morgan Hill, California