Download Queste statistiche in altri paesi:
Linea del tempo:
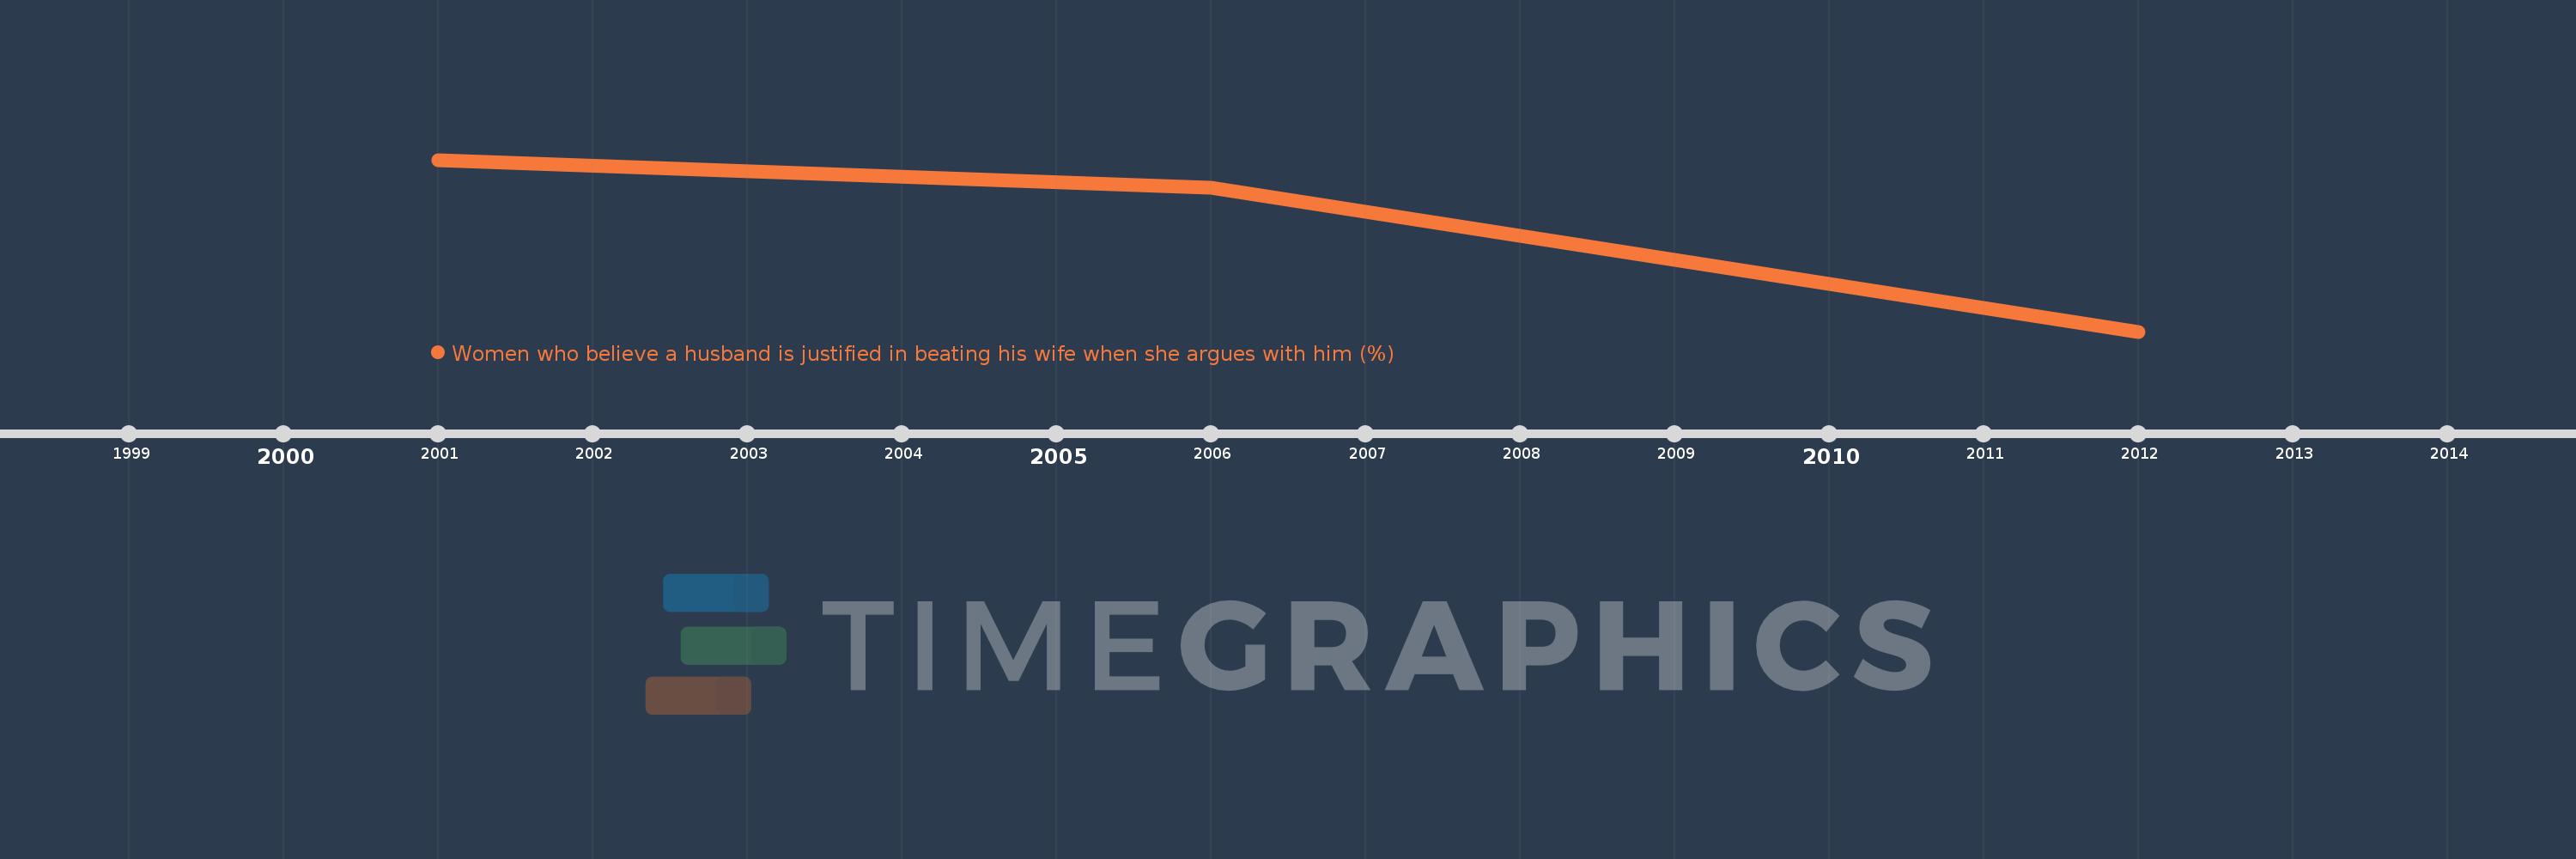
Questa scala temporale mostra un grafico dal 2001 anno al 2012 anno. Ethiopia. I dati fino ad 2000 anno non disponibili. Il numero di osservazioni attuali secondo i date: 3.
La fonte (nome):
Indicatori dello sviluppo mondiale
La fonte (organizzazione):
Demographic and Health Surveys (DHS), Multiple Indicator Cluster Surveys (MICS), and other surveys: STATcompiler (http://www.statcompiler.com/) as of June 9, 2016, UNICEF global databases (http://www.data.unicef.org/) as of November 2015.
MICS Compiler (http://www.micscompiler.org/) as of June 12, 2016.
Categorie:
Health, Gender
sono stati aggiornati
23 apr 2017 anni
Indicatori delle variazioni dei valori per anni
Minima:
45.4
1 gen 2012 anni
Massimo:
61.3
1 gen 2001 anni
Alla data di osservazione
Valore
Variazione assoluta
La variazione rispetto al valore precedente
1 gen 2001 anni
61.3
+61.3
0.0%
1 gen 2006 anni
58.7
-2.6
-4.24%
1 gen 2012 anni
45.4
-13.3
-22.66%
Classificazione dei paesi secondo i statistiche attuali per anni