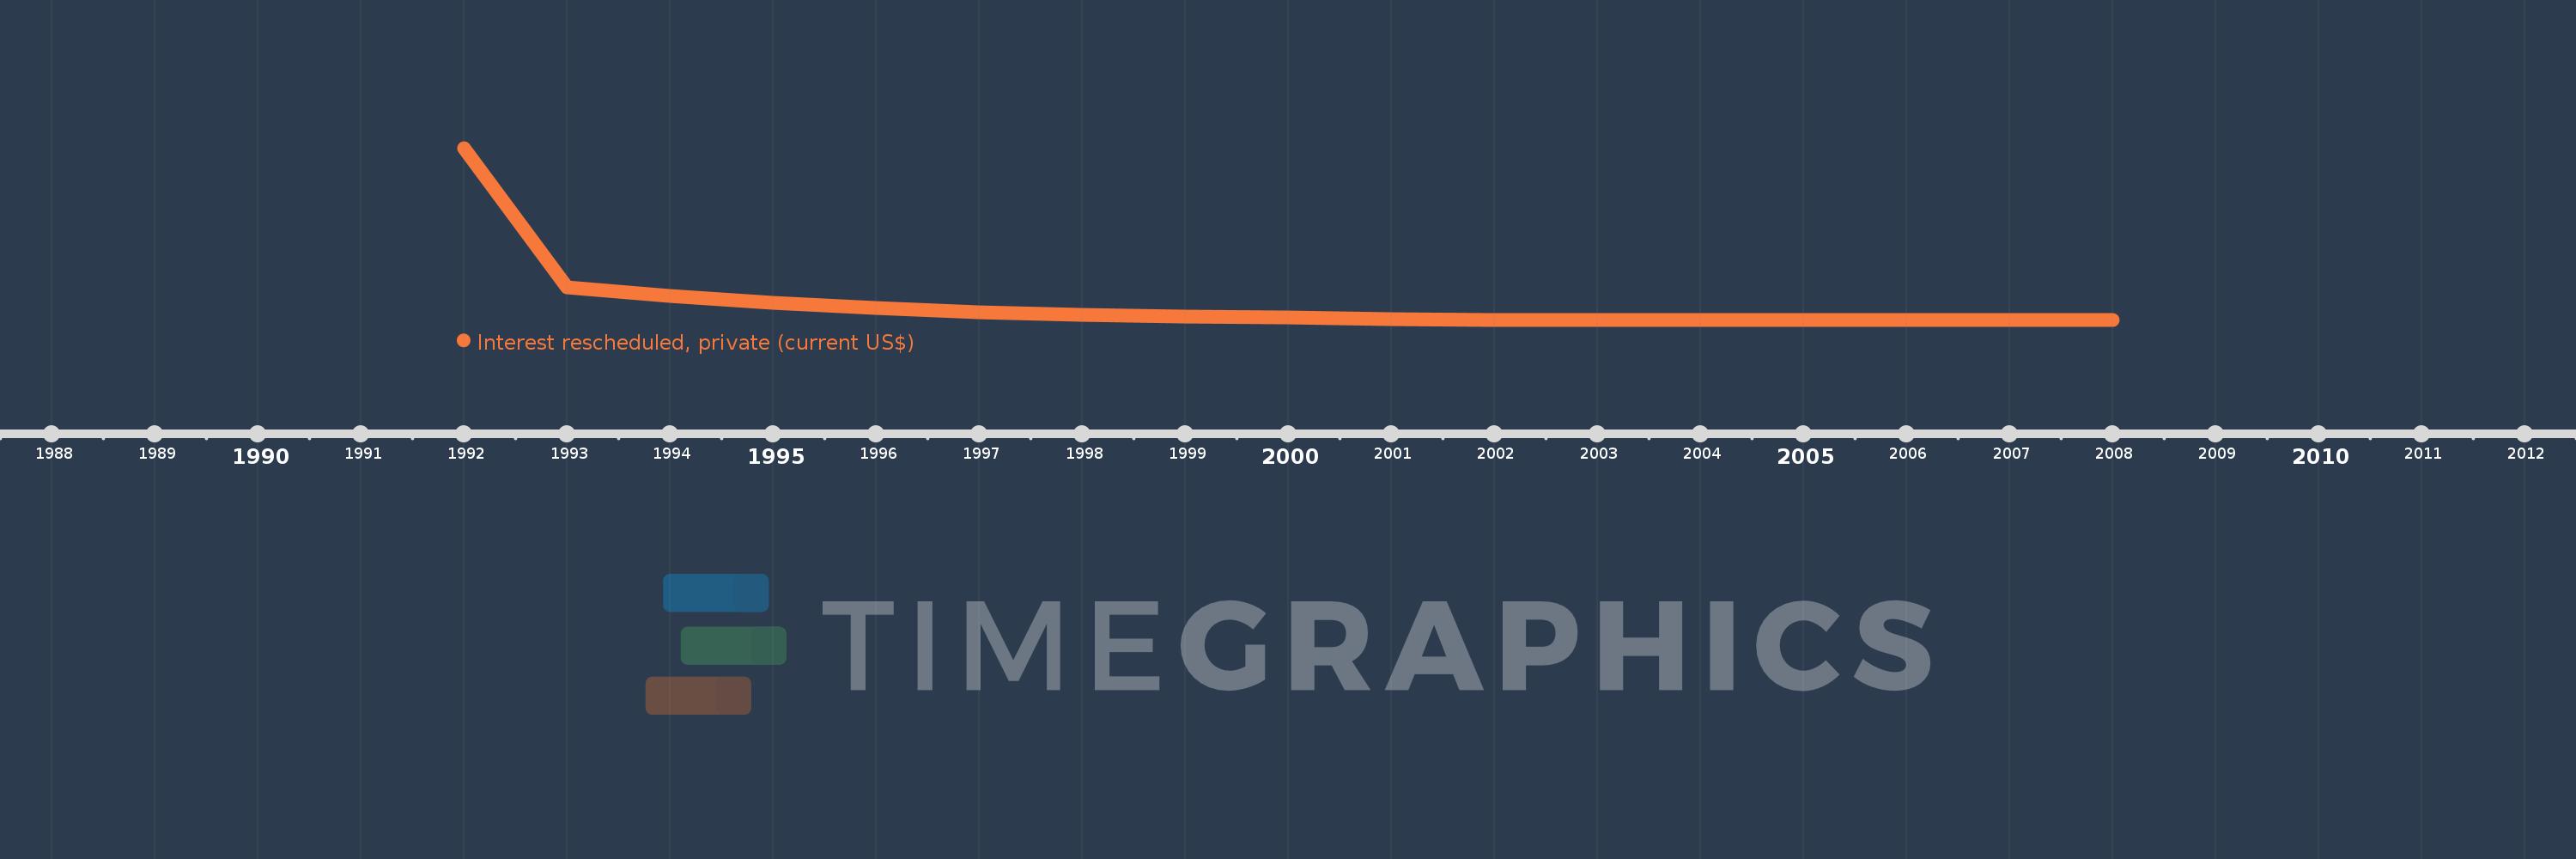
Questa scala temporale mostra un grafico dal 1992 anno al 2008 anno. Egypt, Arab Rep.. I dati fino ad 1991 anno non disponibili. Il numero di osservazioni attuali secondo i date: 17.
La fonte (nome):
Indicatori dello sviluppo mondiale
La fonte (organizzazione):
World Bank, International Debt Statistics.
Categorie:
External Debt
sono stati aggiornati
23 apr 2017 anni
Indicatori delle variazioni dei valori per anni
In media:
53.415 Mln
Minima:
0.0
1 gen 2008 anni
Massimo:
566.627 Mln
1 gen 1992 anni
Alla data di osservazione
Valore
Variazione assoluta
La variazione rispetto al valore precedente
1 gen 1992 anni
566.627 Mln
+566.627 Mln
0.0%
1 gen 1993 anni
107.634 Mln
-458.993 Mln
-81.0%
1 gen 1994 anni
79.689 Mln
-27.945 Mln
-25.96%
1 gen 1995 anni
55.147 Mln
-24.542 Mln
-30.8%
1 gen 1996 anni
39.172 Mln
-15.975 Mln
-28.97%
1 gen 1997 anni
24.702 Mln
-14.47 Mln
-36.94%
1 gen 1998 anni
14.985 Mln
-9.717 Mln
-39.34%
1 gen 1999 anni
9.427 Mln
-5.558 Mln
-37.09%
1 gen 2000 anni
8.773 Mln
-654.0 Mille.
-6.94%
1 gen 2001 anni
880.0 Mille.
-7.893 Mln
-89.97%
1 gen 2002 anni
291.0 Mille.
-589.0 Mille.
-66.93%
1 gen 2003 anni
244.0 Mille.
-47.0 Mille.
-16.15%
1 gen 2004 anni
218.0 Mille.
-26.0 Mille.
-10.66%
1 gen 2005 anni
160.0 Mille.
-58.0 Mille.
-26.61%
1 gen 2006 anni
92.0 Mille.
-68.0 Mille.
-42.5%
1 gen 2007 anni
18.0 Mille.
-74.0 Mille.
-80.43%
1 gen 2008 anni
0.0
-18.0 Mille.
-100.0%
Classificazione dei paesi secondo i statistiche attuali per anni