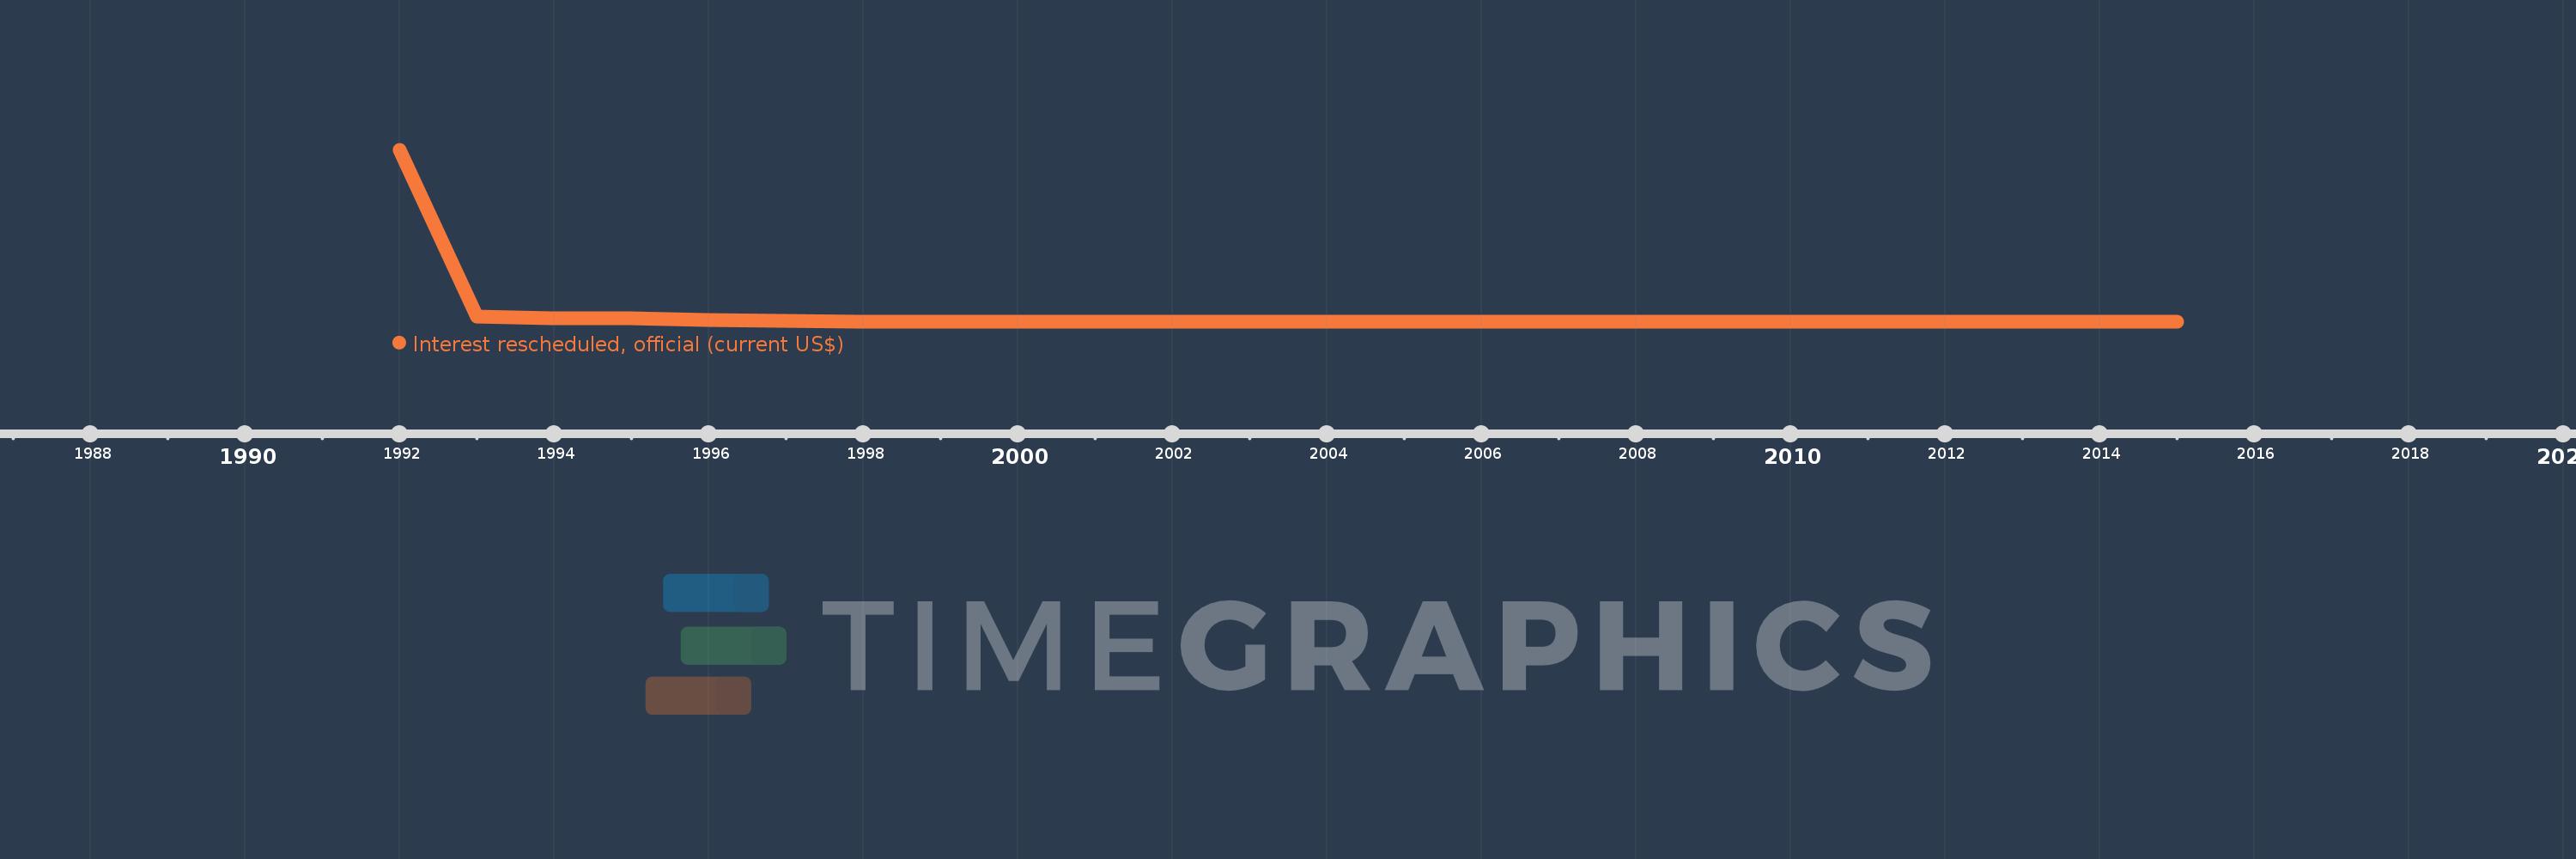
Questa scala temporale mostra un grafico dal 1992 anno al 2015 anno. Egypt, Arab Rep.. I dati fino ad 1991 anno non disponibili. Il numero di osservazioni attuali secondo i date: 18.
La fonte (nome):
Indicatori dello sviluppo mondiale
La fonte (organizzazione):
World Bank, International Debt Statistics.
Categorie:
External Debt
sono stati aggiornati
23 apr 2017 anni
Indicatori delle variazioni dei valori per anni
In media:
63.326 Mln
Minima:
0.0
1 gen 2008 anni
Massimo:
1.038 Mlrd
1 gen 1992 anni
Alla data di osservazione
Valore
Variazione assoluta
La variazione rispetto al valore precedente
1 gen 1992 anni
1.038 Mlrd
+1.038 Mlrd
0.0%
1 gen 1993 anni
32.641 Mln
-1.005 Mlrd
-96.86%
1 gen 1994 anni
23.228 Mln
-9.413 Mln
-28.84%
1 gen 1995 anni
23.294 Mln
+66.0 Mille.
0.28%
1 gen 1996 anni
10.237 Mln
-13.057 Mln
-56.05%
1 gen 1997 anni
6.196 Mln
-4.041 Mln
-39.47%
1 gen 1998 anni
3.291 Mln
-2.905 Mln
-46.89%
1 gen 1999 anni
1.726 Mln
-1.565 Mln
-47.55%
1 gen 2000 anni
787.0 Mille.
-939.0 Mille.
-54.4%
1 gen 2001 anni
223.0 Mille.
-564.0 Mille.
-71.66%
1 gen 2002 anni
97.0 Mille.
-126.0 Mille.
-56.5%
1 gen 2003 anni
8.0 Mille.
-89.0 Mille.
-91.75%
1 gen 2004 anni
7.0 Mille.
-1000.0
-12.5%
1 gen 2005 anni
5.0 Mille.
-2.0 Mille.
-28.57%
1 gen 2006 anni
3.0 Mille.
-2.0 Mille.
-40.0%
1 gen 2007 anni
1000.0
-2.0 Mille.
-66.67%
1 gen 2008 anni
0.0
-1000.0
-100.0%
1 gen 2015 anni
0.0
0.0
%
Classificazione dei paesi secondo i statistiche attuali per anni