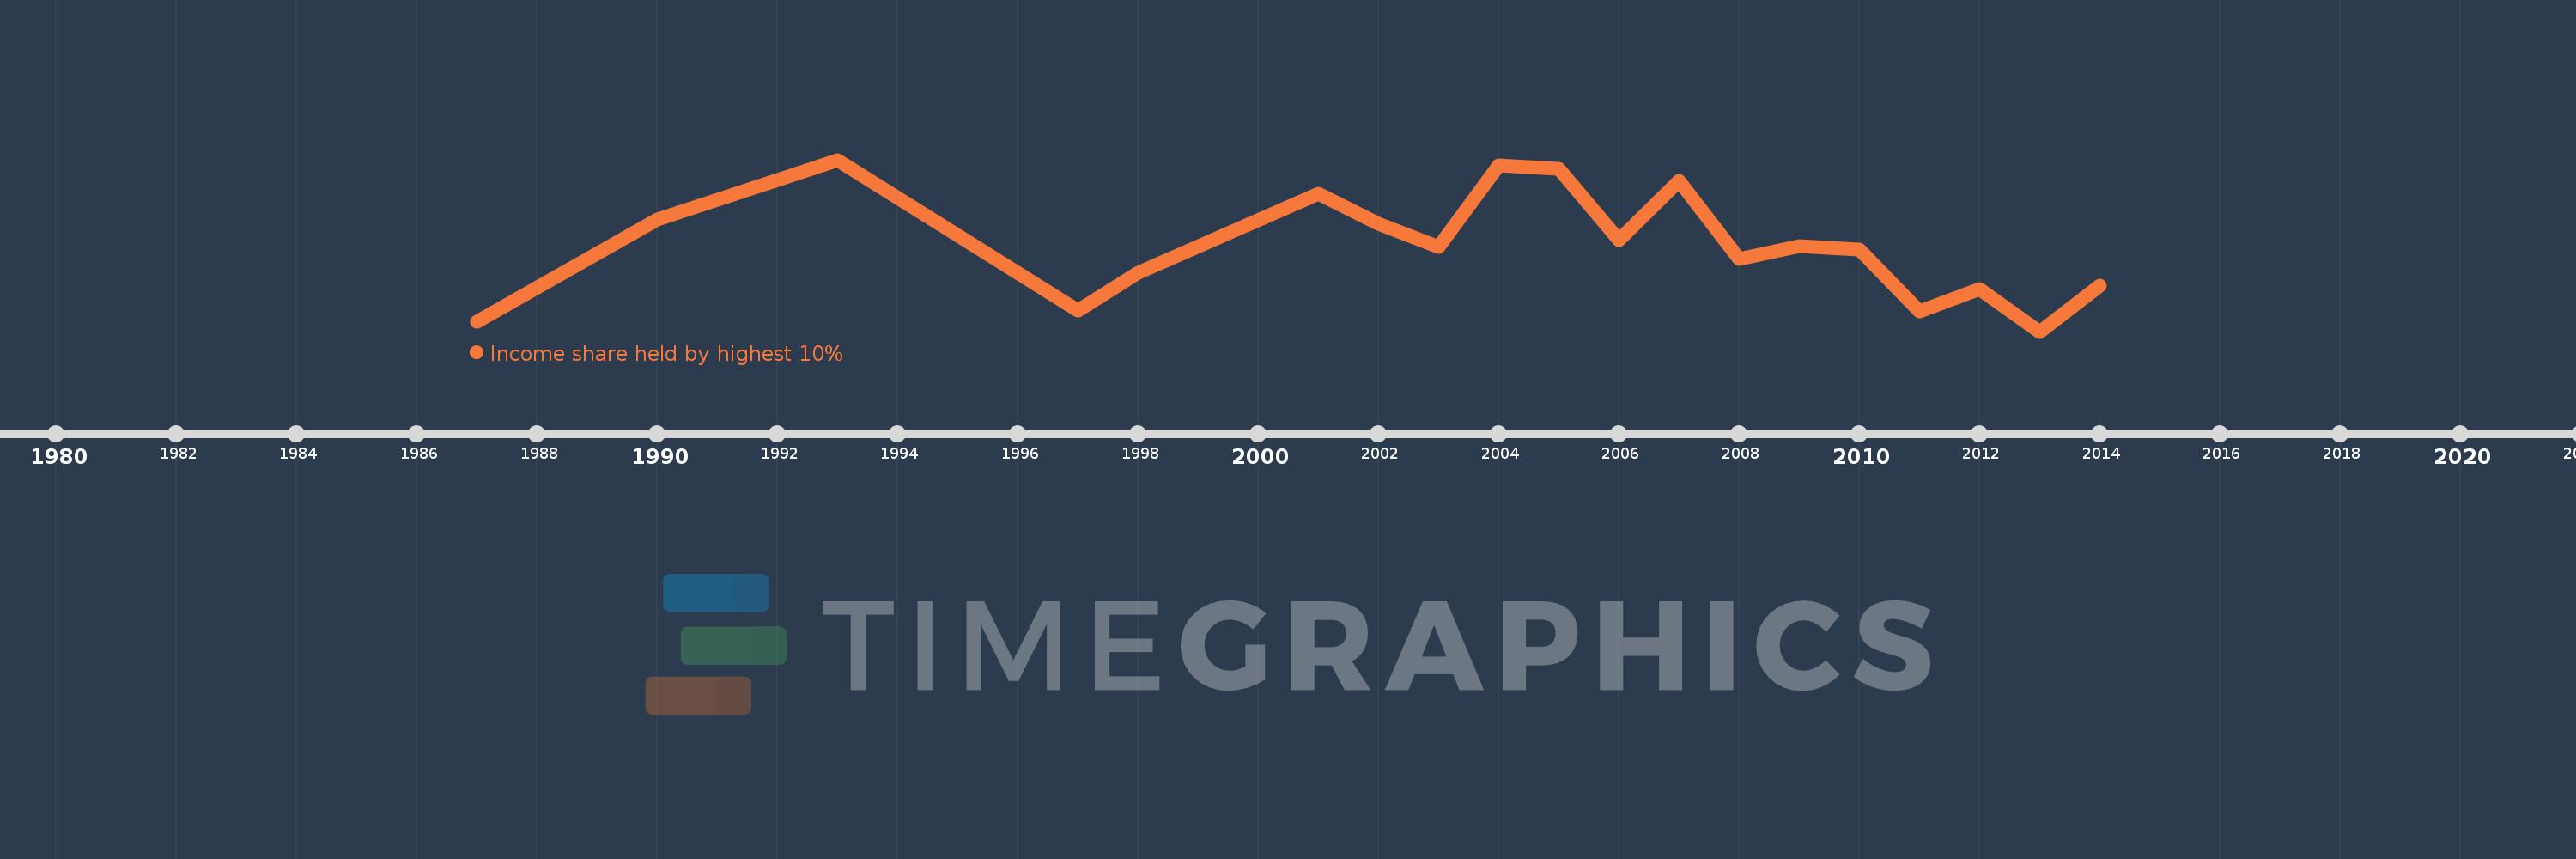
Questa scala temporale mostra un grafico dal 1987 anno al 2014 anno. Dominican Republic. I dati fino ad 1986 anno non disponibili. Il numero di osservazioni attuali secondo i date: 19.
La fonte (nome):
Indicatori dello sviluppo mondiale
La fonte (organizzazione):
World Bank, Development Research Group. Data are based on primary household survey data obtained from government statistical agencies and World Bank country departments. Data for high-income economies are from the Luxembourg Income Study database. For more information and methodology, please see PovcalNet (http://iresearch.worldbank.org/PovcalNet/index.htm).
Categorie:
Poverty
sono stati aggiornati
23 apr 2017 anni
Indicatori delle variazioni dei valori per anni
In media:
38.833
Minima:
35.75
1 gen 2013 anni
Massimo:
41.95
1 gen 1993 anni
Alla data di osservazione
Valore
Variazione assoluta
La variazione rispetto al valore precedente
1 gen 1987 anni
36.11
+36.11
0.0%
1 gen 1990 anni
39.81
+3.7
10.25%
1 gen 1993 anni
41.95
+2.14
5.38%
1 gen 1997 anni
36.5
-5.45
-12.99%
1 gen 1998 anni
37.86
+1.36
3.73%
1 gen 2001 anni
40.72
+2.86
7.55%
1 gen 2002 anni
39.64
-1.08
-2.65%
1 gen 2003 anni
38.79
-0.85
-2.14%
1 gen 2004 anni
41.74
+2.95
7.61%
1 gen 2005 anni
41.64
-0.1
-0.24%
1 gen 2006 anni
39.05
-2.59
-6.22%
1 gen 2007 anni
41.19
+2.14
5.48%
1 gen 2008 anni
38.36
-2.83
-6.87%
1 gen 2009 anni
38.83
+0.47
1.23%
1 gen 2010 anni
38.71
-0.12
-0.31%
1 gen 2011 anni
36.47
-2.24
-5.79%
1 gen 2012 anni
37.3
+0.83
2.28%
1 gen 2013 anni
35.75
-1.55
-4.16%
1 gen 2014 anni
37.41
+1.66
4.64%
Classificazione dei paesi secondo i statistiche attuali per anni