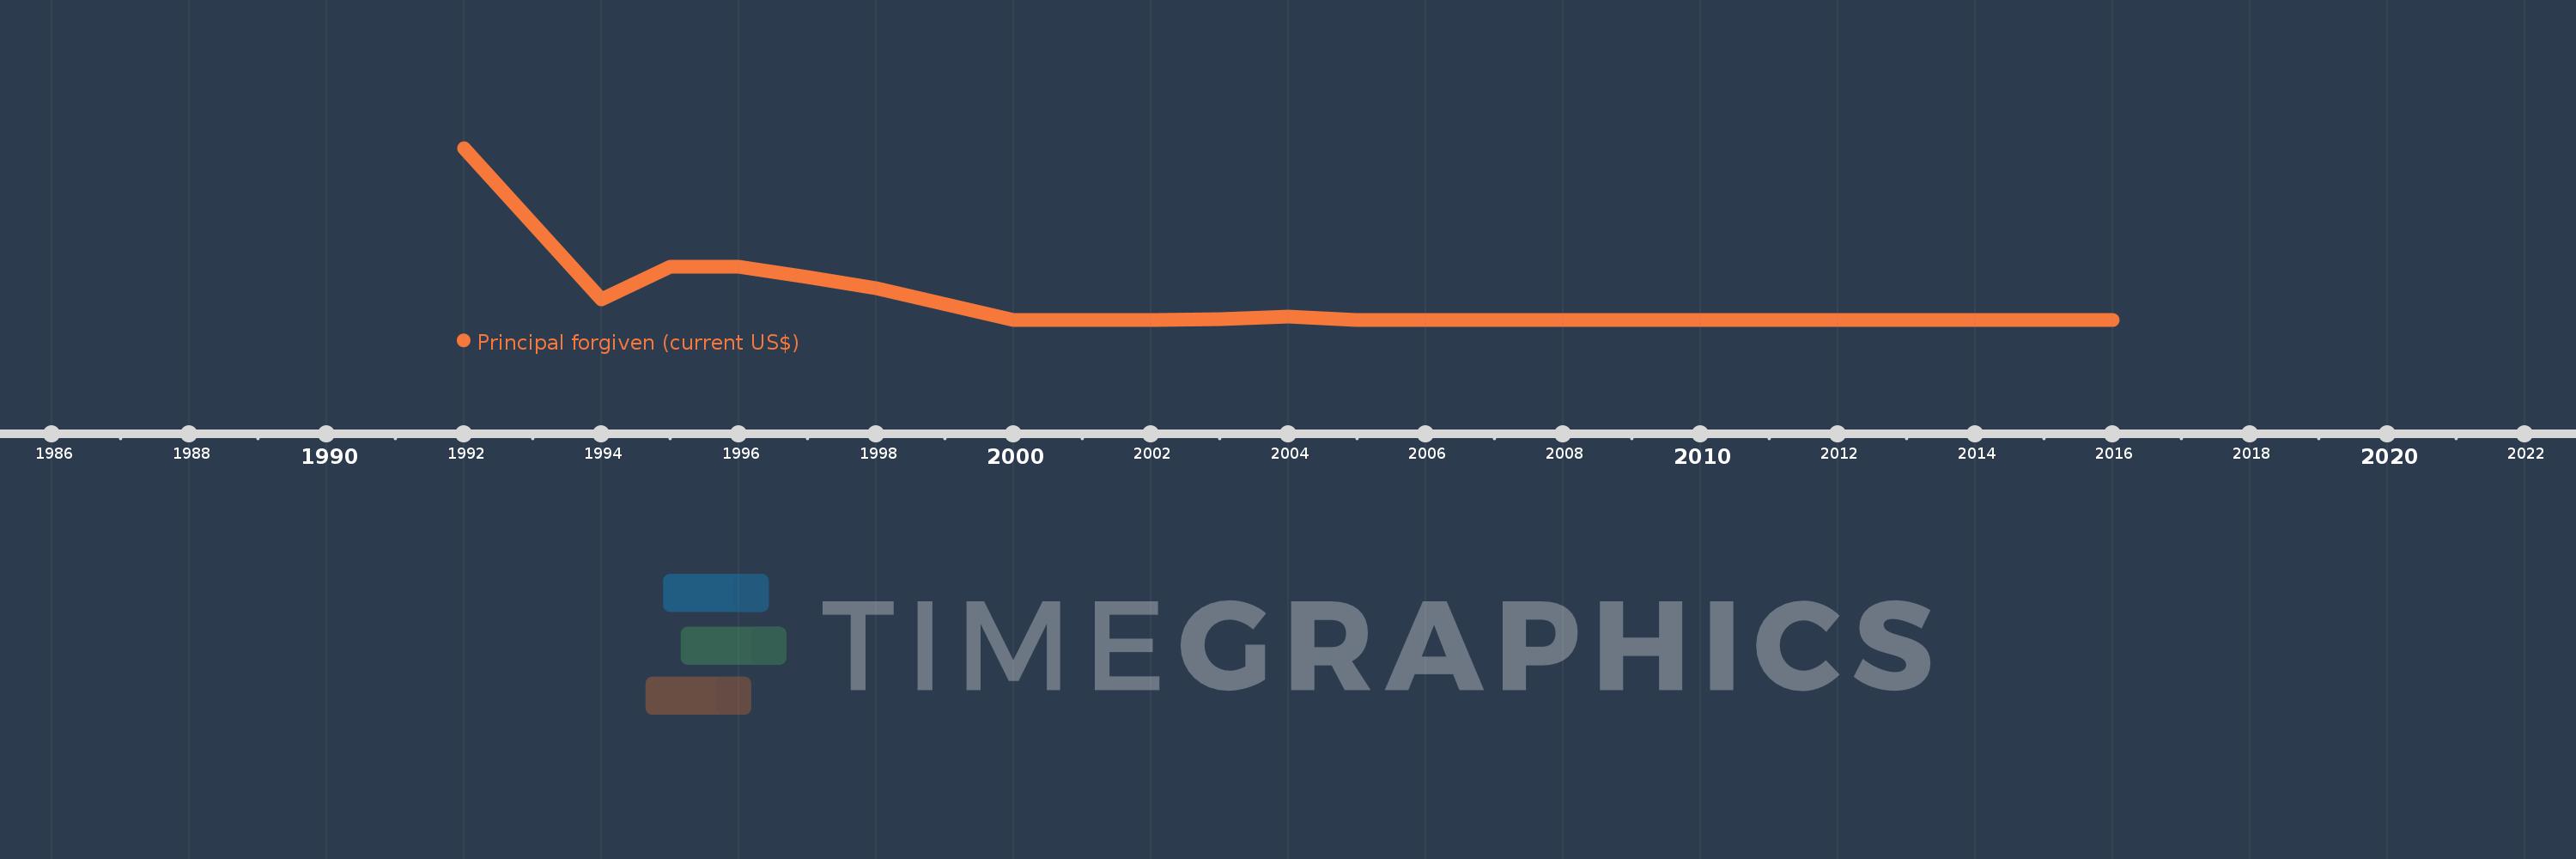
Questa scala temporale mostra un grafico dal 1992 anno al 2016 anno. Costa Rica. I dati fino ad 1991 anno non disponibili. Il numero di osservazioni attuali secondo i date: 22.
La fonte (nome):
Indicatori dello sviluppo mondiale
La fonte (organizzazione):
World Bank, International Debt Statistics.
Categorie:
External Debt
sono stati aggiornati
23 apr 2017 anni
Indicatori delle variazioni dei valori per anni
In media:
847.5 Mille.
Minima:
0.0
1 gen 2000 anni
Massimo:
8.5 Mln
1 gen 1992 anni
Alla data di osservazione
Valore
Variazione assoluta
La variazione rispetto al valore precedente
1 gen 1992 anni
8.5 Mln
+8.5 Mln
0.0%
1 gen 1994 anni
993.0 Mille.
-7.507 Mln
-88.32%
1 gen 1995 anni
2.631 Mln
+1.638 Mln
164.95%
1 gen 1996 anni
2.641 Mln
+10.0 Mille.
0.38%
1 gen 1997 anni
2.12 Mln
-521.0 Mille.
-19.73%
1 gen 1998 anni
1.552 Mln
-568.0 Mille.
-26.79%
1 gen 2000 anni
0.0
-1.552 Mln
-100.0%
1 gen 2002 anni
0.0
0.0
%
1 gen 2003 anni
50.0 Mille.
+50.0 Mille.
%
1 gen 2004 anni
158.0 Mille.
+108.0 Mille.
216.0%
1 gen 2005 anni
0.0
-158.0 Mille.
-100.0%
1 gen 2006 anni
0.0
0.0
%
1 gen 2007 anni
0.0
0.0
%
1 gen 2008 anni
0.0
0.0
%
1 gen 2009 anni
0.0
0.0
%
1 gen 2010 anni
0.0
0.0
%
1 gen 2011 anni
0.0
0.0
%
1 gen 2012 anni
0.0
0.0
%
1 gen 2013 anni
0.0
0.0
%
1 gen 2014 anni
0.0
0.0
%
1 gen 2015 anni
0.0
0.0
%
1 gen 2016 anni
0.0
0.0
%
Classificazione dei paesi secondo i statistiche attuali per anni