30
/it/
AIzaSyAYiBZKx7MnpbEhh9jyipgxe19OcubqV5w
April 1, 2024
111273
Congo, Rep.
COG
true
2
1
Net bilateral aid flows from DAC donors, Luxembourg (current US$)
2015,2013,2012,2011,2009,2008,2007,2006,2005,2004,2003,2002,2001,2000,1997
Download
Biblioteca di statistiche globali →Congo, Rep. →

Net bilateral aid flows from DAC donors, Luxembourg (current US$)

Queste statistiche in altri paesi:

AfghanistanAlbaniaAlgeriaAngolaArab WorldArgentinaArmeniaAzerbaijanBangladeshBelarusBelizeBeninBhutanBoliviaBosnia and HerzegovinaBotswanaBrazilBulgariaBurkina FasoBurundiCabo VerdeCambodiaCameroonCaribbean small statesCentral African RepublicCentral Europe and the BalticsChadChileChinaColombiaComorosCongo, Dem. Rep.Congo, Rep.Costa RicaCote d'IvoireCroatiaCubaCzech RepublicDjiboutiDominicaDominican RepublicEast Asia & PacificEast Asia & Pacific (excluding high income)East Asia & Pacific (IDA & IBRD countries)EcuadorEgypt, Arab Rep.El SalvadorEquatorial GuineaEritreaEstoniaEthiopiaEuro areaEurope & Central AsiaEurope & Central Asia (excluding high income)Europe & Central Asia (IDA & IBRD countries)European UnionFijiFragile and conflict affected situationsGabonGambia, TheGeorgiaGhanaGrenadaGuatemalaGuineaGuinea-BissauGuyanaHaitiHeavily indebted poor countries (HIPC)High incomeHondurasHungaryIBRD onlyIDA & IBRD totalIDA blendIDA onlyIDA totalIndiaIndonesiaIran, Islamic Rep.IraqIsraelJamaicaJordanKazakhstanKenyaKorea, Dem. People’s Rep.Korea, Rep.KosovoKyrgyz RepublicLao PDRLatin America & Caribbean Latin America & Caribbean (excluding high income)Latin America & the Caribbean (IDA & IBRD countries)LatviaLeast developed countries: UN classificationLebanonLesothoLiberiaLibyaLithuaniaLow & middle incomeLow incomeLower middle incomeMacedonia, FYRMadagascarMalawiMalaysiaMaldivesMaliMauritaniaMauritiusMexicoMicronesia, Fed. Sts.Middle East & North AfricaMiddle East & North Africa (excluding high income)Middle East & North Africa (IDA & IBRD countries)Middle incomeMoldovaMongoliaMontenegroMoroccoMozambiqueMyanmarNamibiaNepalNicaraguaNigerNigeriaOECD membersOther small statesPacific island small statesPakistanPalauPanamaParaguayPeruPhilippinesPolandRomaniaRussian FederationRwandaSamoaSao Tome and PrincipeSenegalSerbiaSierra LeoneSlovak RepublicSloveniaSmall statesSomaliaSouth AfricaSouth AsiaSouth Asia (IDA & IBRD)South SudanSri LankaSt. LuciaSub-Saharan Africa Sub-Saharan Africa (excluding high income)Sub-Saharan Africa (IDA & IBRD countries)SudanSwazilandSyrian Arab RepublicTajikistanTanzaniaThailandTimor-LesteTogoTunisiaTurkeyTurkmenistanUgandaUkraineUpper middle incomeUruguayUzbekistanVanuatuVenezuela, RBVietnamWest Bank and GazaWorldYemen, Rep.ZambiaZimbabwe

Linea del tempo:

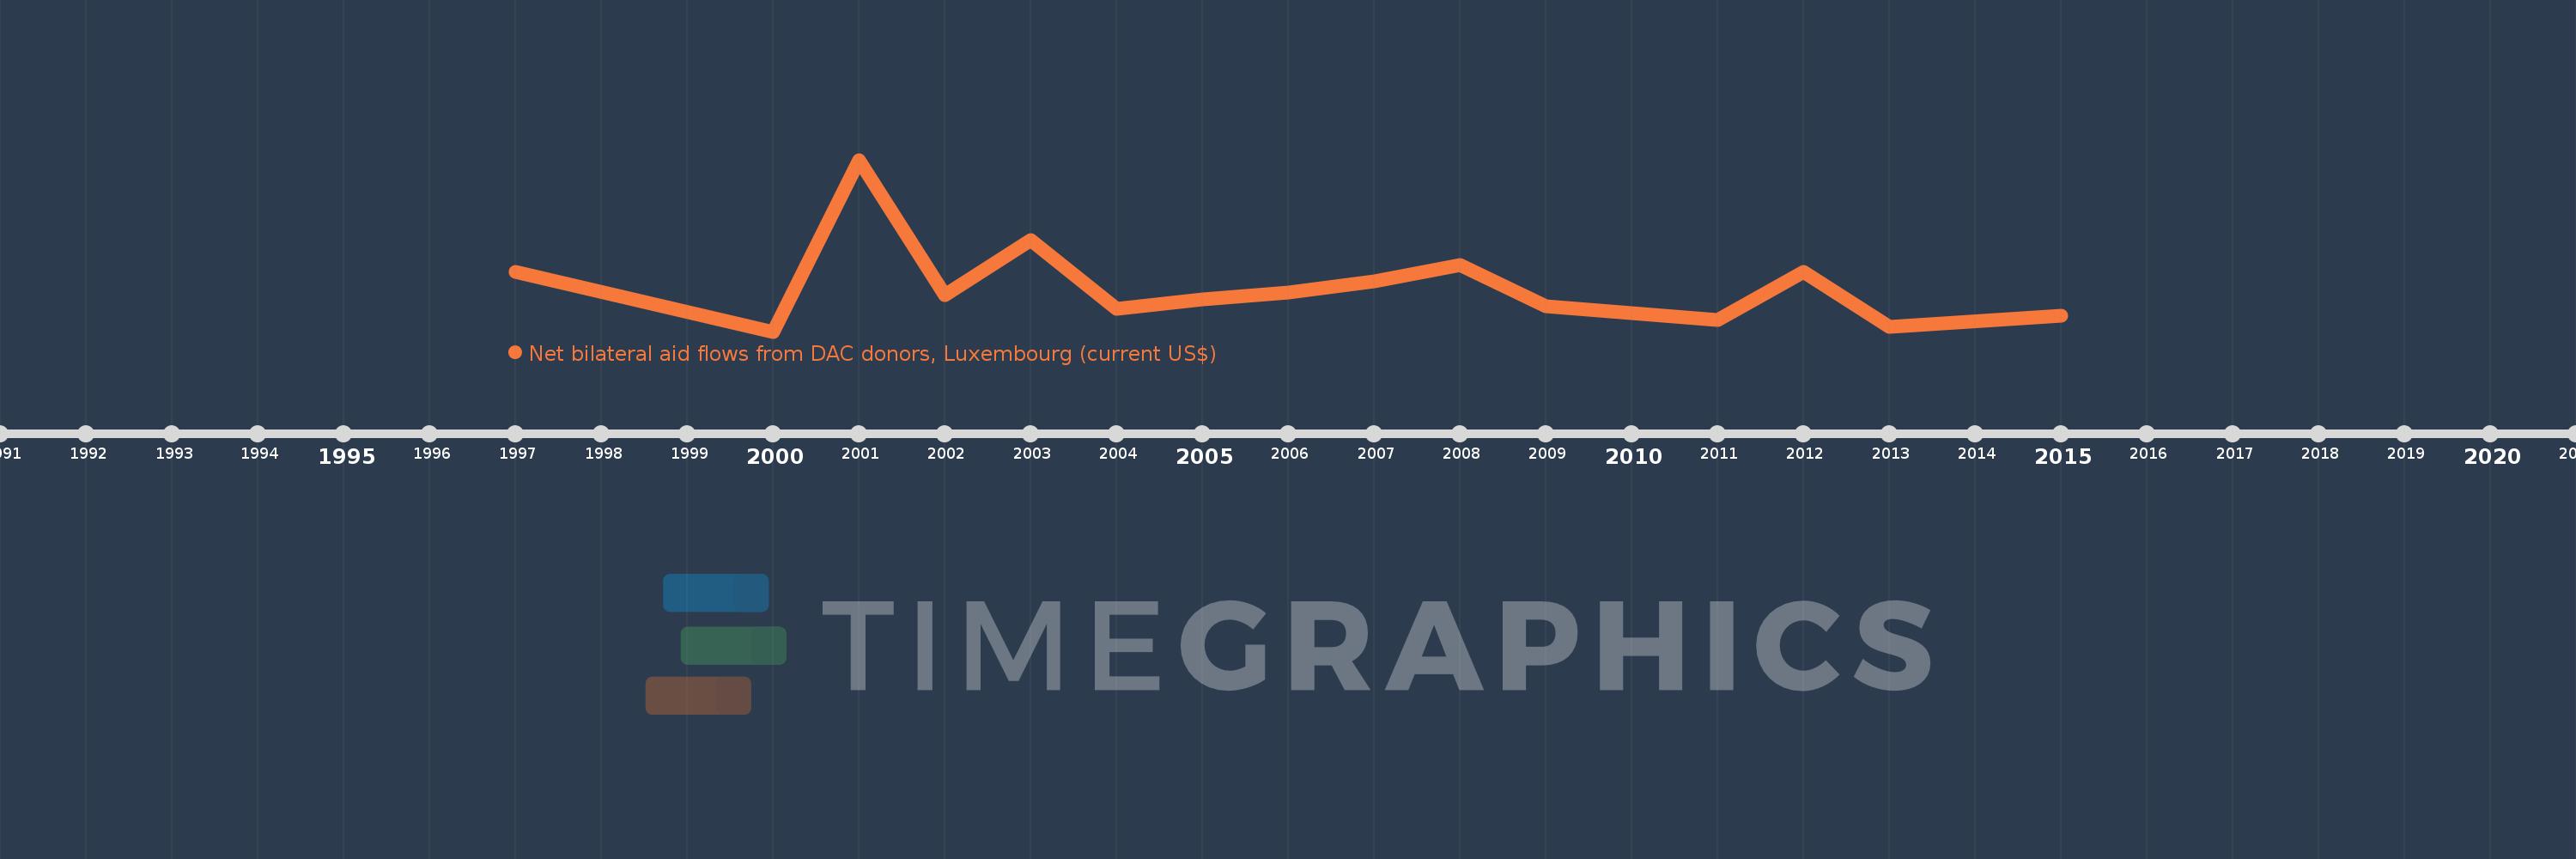
Questa scala temporale mostra un grafico dal 1997 anno al 2015 anno. Congo, Rep.. I dati fino ad 1996 anno non disponibili. Il numero di osservazioni attuali secondo i date: 15.

La fonte (nome):

Indicatori dello sviluppo mondiale

La fonte (organizzazione):

Development Assistance Committee of the Organisation for Economic Co-operation and Development, Geographical Distribution of Financial Flows to Developing Countries, Development Co-operation Report, and International Development Statistics database. Data are available online at: www.oecd.org/dac/stats/idsonline.

Categorie:

Aid Effectiveness

sono stati aggiornati

23 apr 2017 anni

Indicatori delle variazioni dei valori per anni

In media:
220.0 Mille.
Minima:
20.0 Mille.
1 gen 2000 anni
Massimo:
770.0 Mille.
1 gen 2001 anni
Alla data di osservazione
Valore
Variazione assoluta
La variazione rispetto al valore precedente
1 gen 1997 anni
280.0 Mille.
+280.0 Mille.
0.0%
1 gen 2000 anni
20.0 Mille.
-260.0 Mille.
-92.86%
1 gen 2001 anni
770.0 Mille.
+750.0 Mille.
3.75 Mille.%
1 gen 2002 anni
180.0 Mille.
-590.0 Mille.
-76.62%
1 gen 2003 anni
420.0 Mille.
+240.0 Mille.
133.33%
1 gen 2004 anni
120.0 Mille.
-300.0 Mille.
-71.43%
1 gen 2005 anni
160.0 Mille.
+40.0 Mille.
33.33%
1 gen 2006 anni
190.0 Mille.
+30.0 Mille.
18.75%
1 gen 2007 anni
240.0 Mille.
+50.0 Mille.
26.32%
1 gen 2008 anni
310.0 Mille.
+70.0 Mille.
29.17%
1 gen 2009 anni
130.0 Mille.
-180.0 Mille.
-58.06%
1 gen 2011 anni
70.0 Mille.
-60.0 Mille.
-46.15%
1 gen 2012 anni
280.0 Mille.
+210.0 Mille.
300.0%
1 gen 2013 anni
40.0 Mille.
-240.0 Mille.
-85.71%
1 gen 2015 anni
90.0 Mille.
+50.0 Mille.
125.0%

Classificazione dei paesi secondo i statistiche attuali per anni