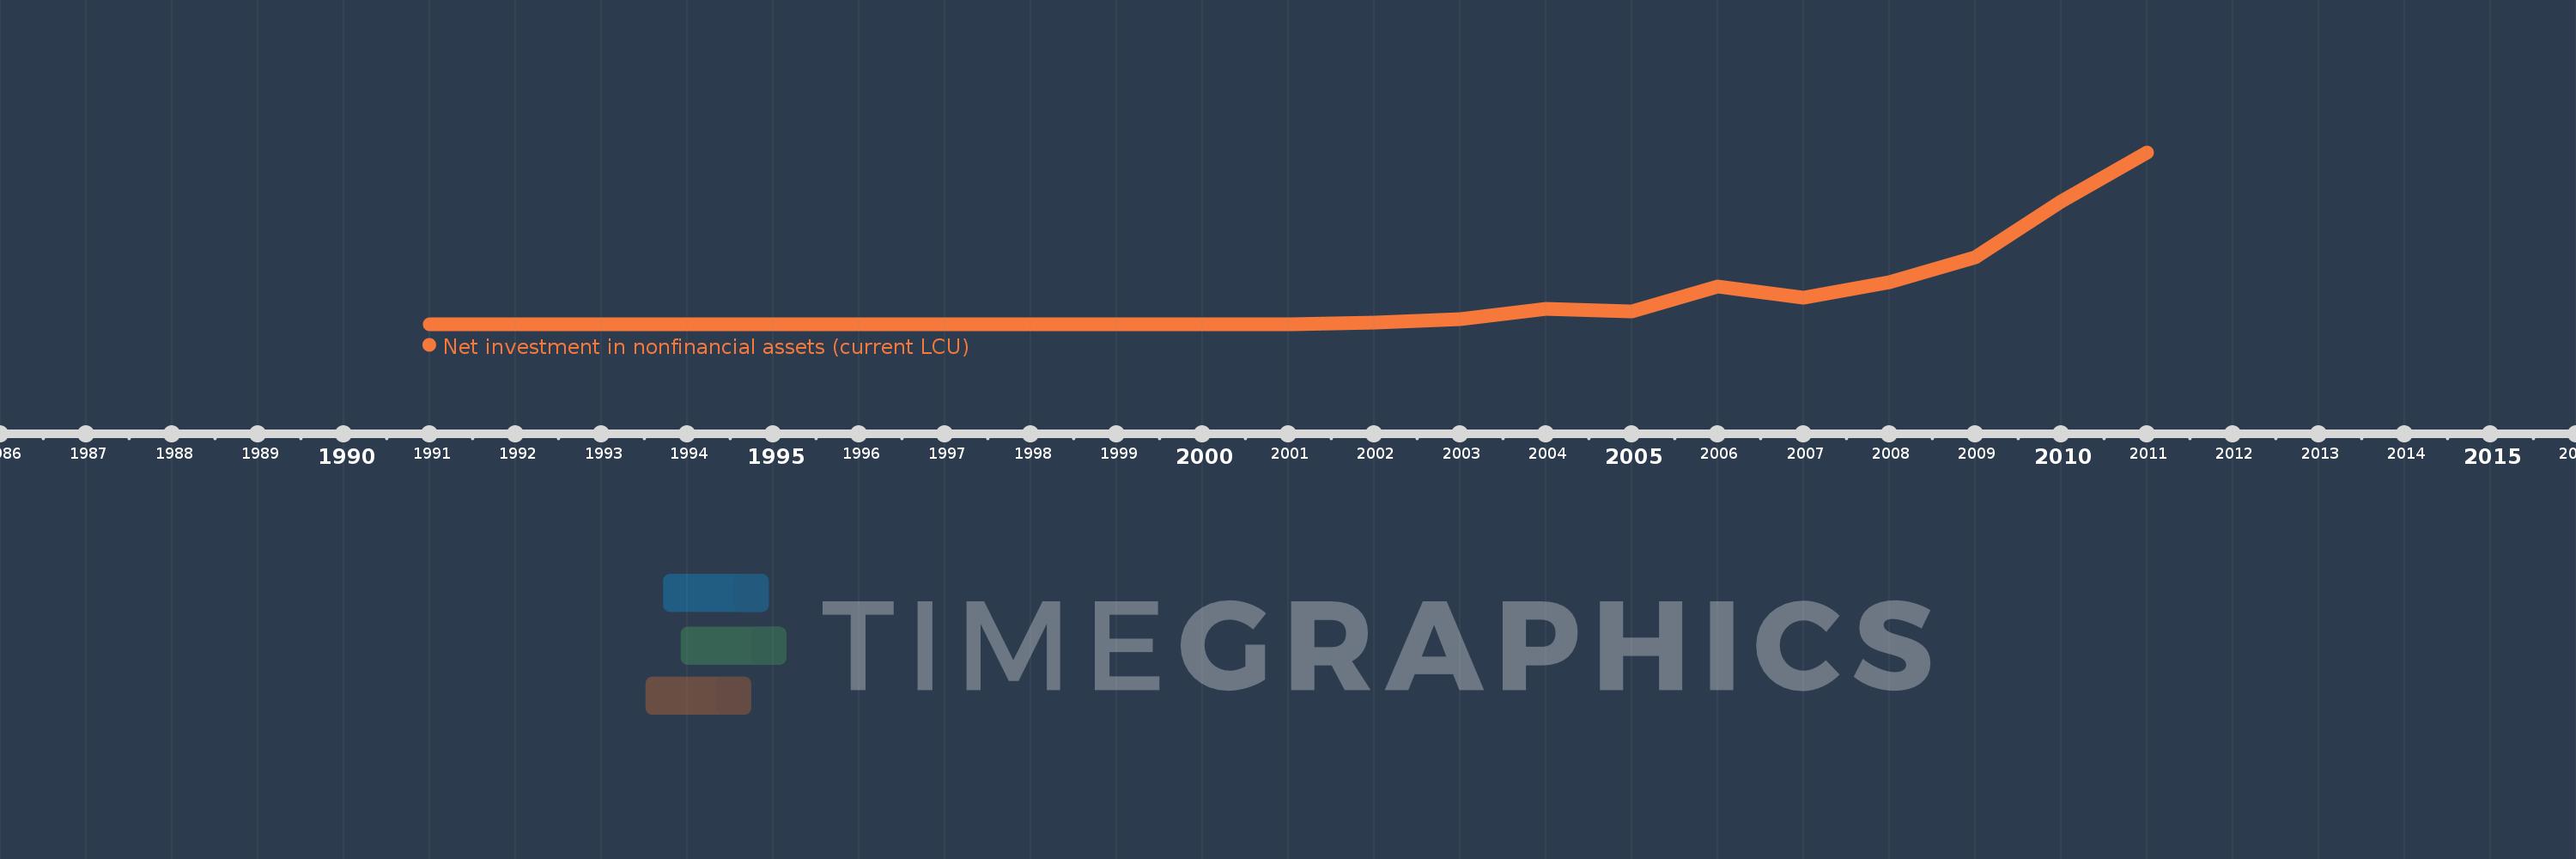
Questa scala temporale mostra un grafico dal 1991 anno al 2011 anno. Congo, Dem. Rep.. I dati fino ad 1990 anno non disponibili. Il numero di osservazioni attuali secondo i date: 21.
La fonte (nome):
Indicatori dello sviluppo mondiale
La fonte (organizzazione):
International Monetary Fund, Government Finance Statistics Yearbook and data files.
Categorie:
Public Sector
sono stati aggiornati
23 apr 2017 anni
Indicatori delle variazioni dei valori per anni
In media:
271.318 Mlrd
Minima:
0.155
1 gen 1991 anni
Massimo:
1.946 Trln
1 gen 2011 anni
Alla data di osservazione
Valore
Variazione assoluta
La variazione rispetto al valore precedente
1 gen 1991 anni
0.155
+0.155
0.0%
1 gen 1992 anni
3.173
+3.018
1.94 Mille.%
1 gen 1993 anni
133.007
+129.833
4.09 Mille.%
1 gen 1994 anni
1.1 Mille.
+966.993
727.03%
1 gen 1995 anni
134.37 Mille.
+133.27 Mille.
12.12 Mille.%
1 gen 1996 anni
350.0 Mille.
+215.63 Mille.
160.47%
1 gen 1997 anni
4.41 Mln
+4.06 Mln
1.16 Mille.%
1 gen 1998 anni
12.88 Mln
+8.47 Mln
192.06%
1 gen 1999 anni
1.125 Mln
-11.755 Mln
-91.27%
1 gen 2000 anni
554.0 Mln
+552.875 Mln
49.14 Mille.%
1 gen 2001 anni
2.809 Mlrd
+2.255 Mlrd
407.06%
1 gen 2002 anni
22.8 Mlrd
+19.991 Mlrd
711.64%
1 gen 2003 anni
54.736 Mlrd
+31.936 Mlrd
140.07%
1 gen 2004 anni
178.474 Mlrd
+123.738 Mlrd
226.07%
1 gen 2005 anni
140.407 Mlrd
-38.067 Mlrd
-21.33%
1 gen 2006 anni
429.757 Mlrd
+289.349 Mlrd
206.08%
1 gen 2007 anni
298.076 Mlrd
-131.681 Mlrd
-30.64%
1 gen 2008 anni
477.424 Mlrd
+179.348 Mlrd
60.17%
1 gen 2009 anni
758.46 Mlrd
+281.036 Mlrd
58.86%
1 gen 2010 anni
1.388 Trln
+629.739 Mlrd
83.03%
1 gen 2011 anni
1.946 Trln
+557.771 Mlrd
40.18%
Classificazione dei paesi secondo i statistiche attuali per anni