30
/it/
AIzaSyAYiBZKx7MnpbEhh9jyipgxe19OcubqV5w
April 1, 2024
108621
Comoros
COM
true
2
1
IDA resource allocation index (1=low to 6=high)
2016,2015,2014,2013,2012,2011,2010,2009,2008,2007,2006
Download
Biblioteca di statistiche globali →Comoros →

IDA resource allocation index (1=low to 6=high)

Queste statistiche in altri paesi:

AfghanistanAlbaniaAngolaArab WorldArmeniaAzerbaijanBangladeshBeninBhutanBoliviaBosnia and HerzegovinaBurkina FasoBurundiCabo VerdeCambodiaCameroonCaribbean small statesCentral African RepublicChadComorosCongo, Dem. Rep.Congo, Rep.Cote d'IvoireDjiboutiDominicaEarly-demographic dividendEast Asia & PacificEast Asia & Pacific (excluding high income)East Asia & Pacific (IDA & IBRD countries)EritreaEthiopiaEurope & Central AsiaEurope & Central Asia (excluding high income)Europe & Central Asia (IDA & IBRD countries)Fragile and conflict affected situationsGambia, TheGeorgiaGhanaGrenadaGuineaGuinea-BissauGuyanaHaitiHeavily indebted poor countries (HIPC)HondurasIBRD onlyIDA & IBRD totalIDA blendIDA onlyIDA totalIndiaIndonesiaKenyaKiribatiKosovoKyrgyz RepublicLao PDRLate-demographic dividendLatin America & Caribbean Latin America & Caribbean (excluding high income)Latin America & the Caribbean (IDA & IBRD countries)Least developed countries: UN classificationLesothoLiberiaLow & middle incomeLow incomeLower middle incomeMadagascarMalawiMaldivesMaliMarshall IslandsMauritaniaMicronesia, Fed. Sts.Middle East & North AfricaMiddle East & North Africa (excluding high income)Middle East & North Africa (IDA & IBRD countries)Middle incomeMoldovaMongoliaMozambiqueMyanmarNepalNicaraguaNigerNigeriaOther small statesPacific island small statesPakistanPapua New GuineaPost-demographic dividendPre-demographic dividendRwandaSamoaSao Tome and PrincipeSenegalSerbiaSierra LeoneSmall statesSolomon IslandsSouth AsiaSouth Asia (IDA & IBRD)South SudanSri LankaSt. LuciaSt. Vincent and the GrenadinesSub-Saharan Africa Sub-Saharan Africa (excluding high income)Sub-Saharan Africa (IDA & IBRD countries)SudanTajikistanTanzaniaTimor-LesteTogoTongaTuvaluUgandaUpper middle incomeUzbekistanVanuatuVietnamWorldYemen, Rep.ZambiaZimbabwe

Linea del tempo:

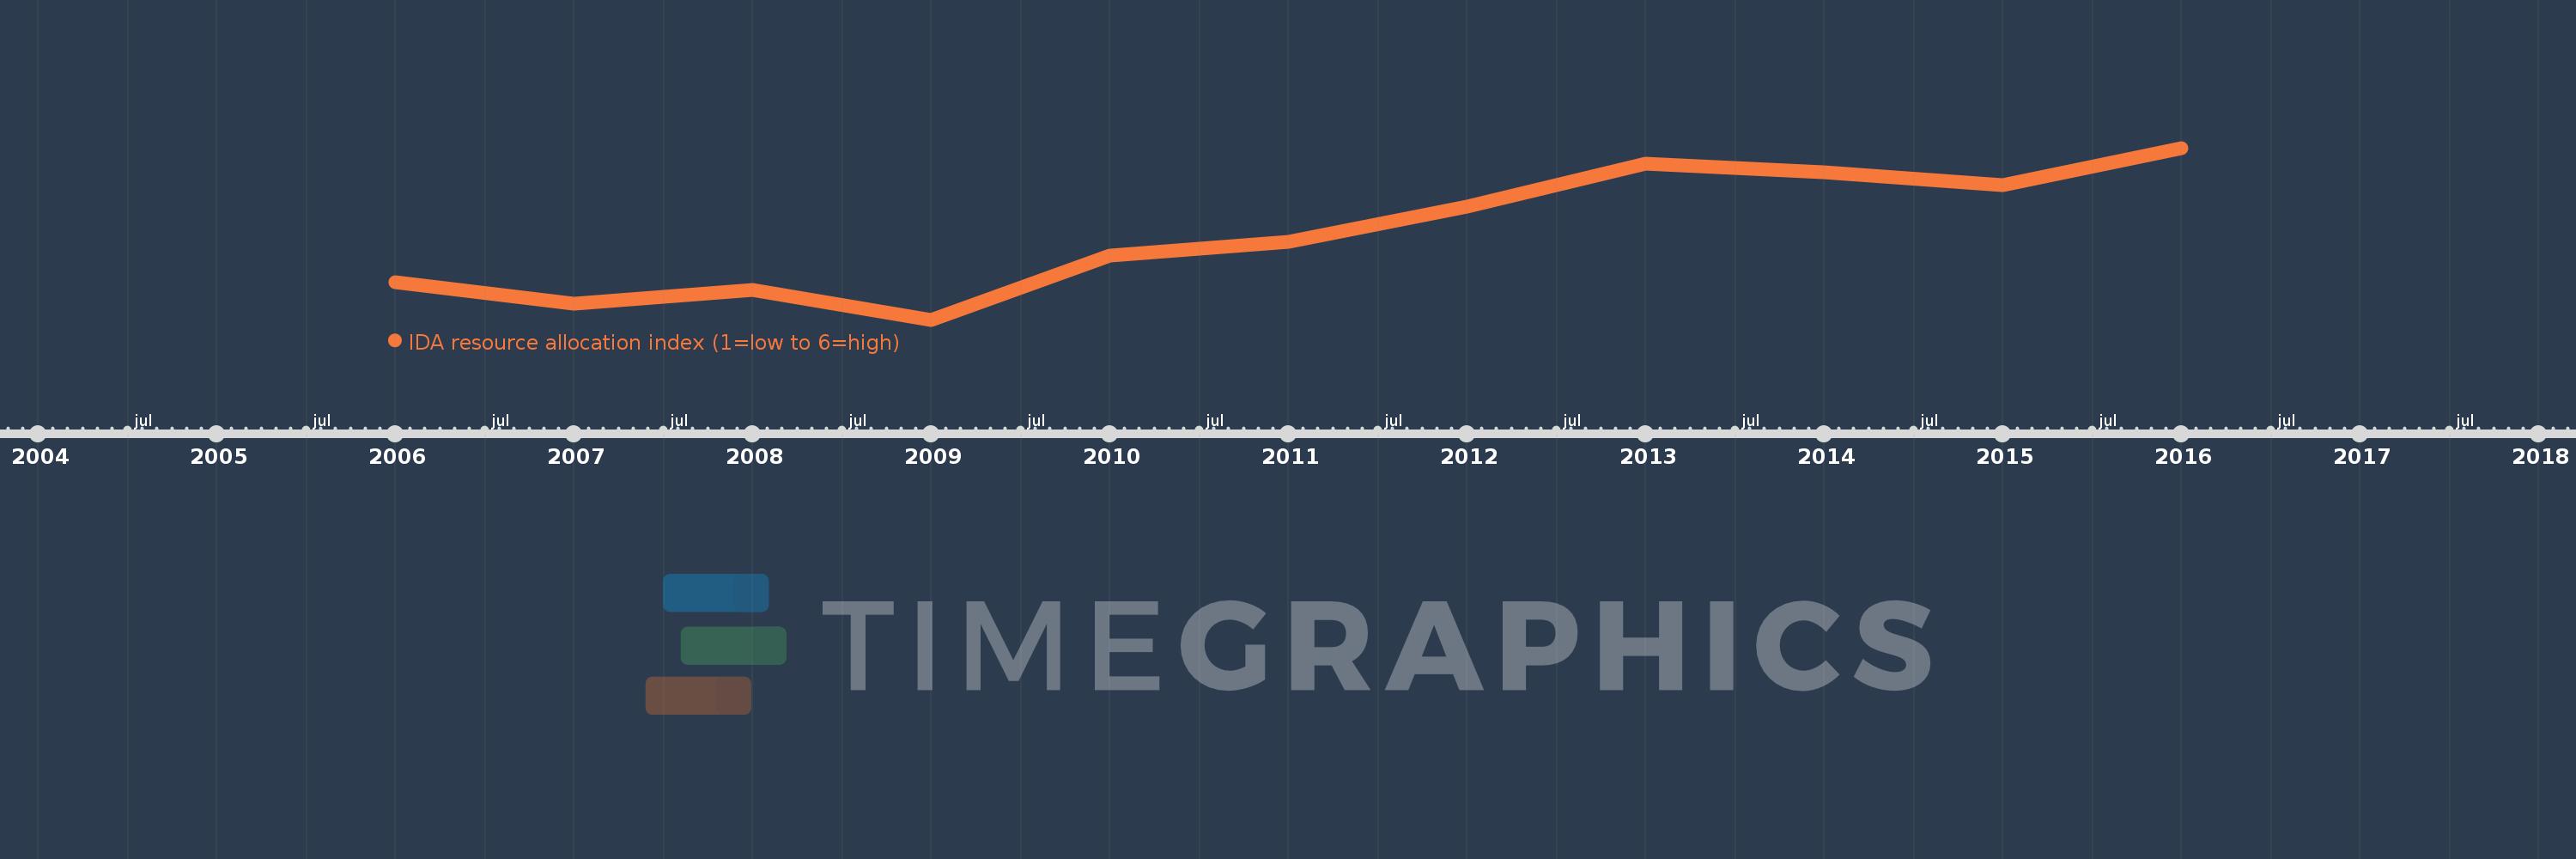
Questa scala temporale mostra un grafico dal 2006 anno al 2016 anno. Comoros. I dati fino ad 2005 anno non disponibili. Il numero di osservazioni attuali secondo i date: 11.

La fonte (nome):

Indicatori dello sviluppo mondiale

La fonte (organizzazione):

World Bank Group, CPIA database (http://www.worldbank.org/ida).

Categorie:

Public Sector

sono stati aggiornati

23 apr 2017 anni

Indicatori delle variazioni dei valori per anni

In media:
2.567
Minima:
2.3
1 gen 2009 anni
Massimo:
2.833
1 gen 2016 anni
Alla data di osservazione
Valore
Variazione assoluta
La variazione rispetto al valore precedente
1 gen 2006 anni
2.417
+2.417
0.0%
1 gen 2007 anni
2.35
-0.067
-2.76%
1 gen 2008 anni
2.392
+0.042
1.77%
1 gen 2009 anni
2.3
-0.092
-3.83%
1 gen 2010 anni
2.5
+0.2
8.7%
1 gen 2011 anni
2.542
+0.042
1.67%
1 gen 2012 anni
2.65
+0.108
4.26%
1 gen 2013 anni
2.783
+0.133
5.03%
1 gen 2014 anni
2.758
-0.025
-0.9%
1 gen 2015 anni
2.717
-0.042
-1.51%
1 gen 2016 anni
2.833
+0.117
4.29%

Classificazione dei paesi secondo i statistiche attuali per anni