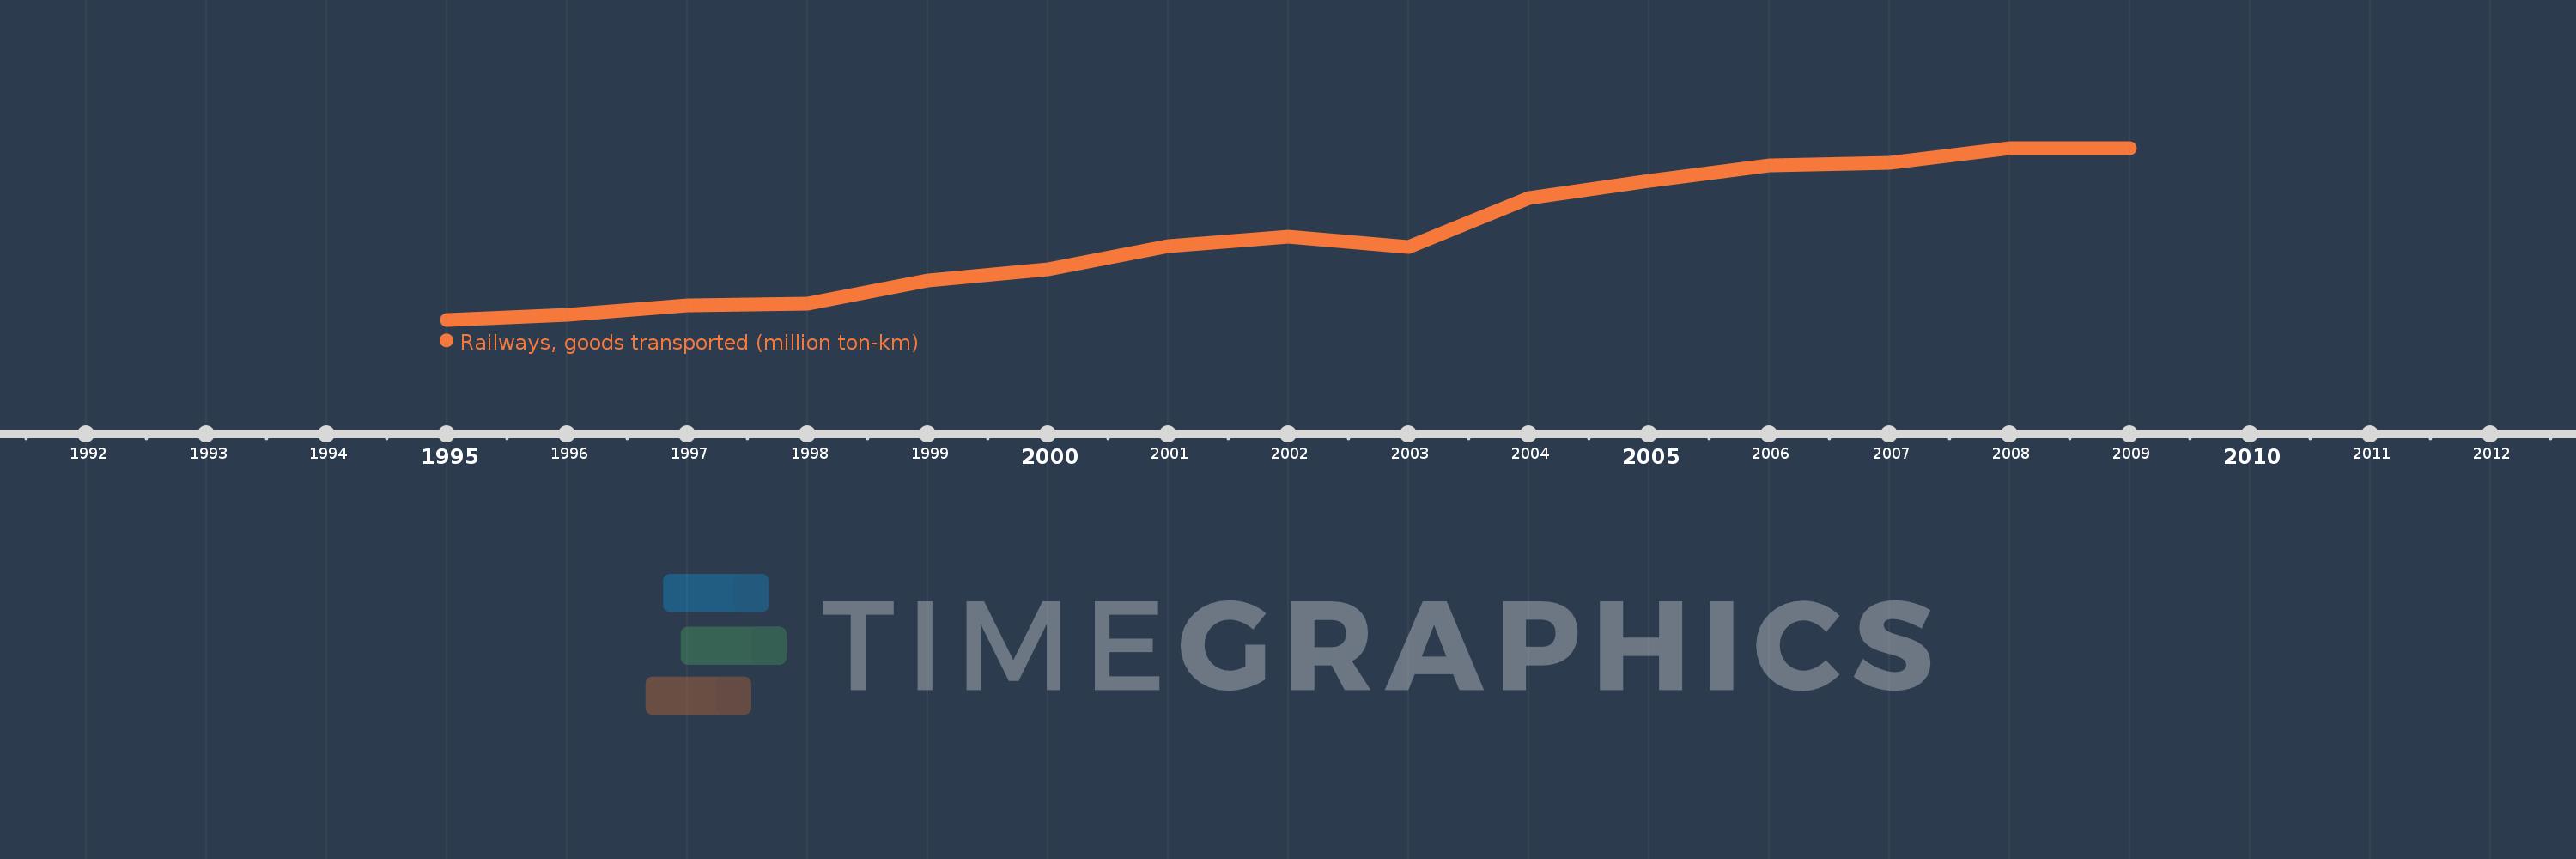
Questa scala temporale mostra un grafico dal 1995 anno al 2009 anno. Colombia. I dati fino ad 1994 anno non disponibili. Il numero di osservazioni attuali secondo i date: 15.
La fonte (nome):
Indicatori dello sviluppo mondiale
La fonte (organizzazione):
World Bank, Transportation, Water, and Information and Communications Technologies Department, Transport Division.
Categorie:
Infrastructure
sono stati aggiornati
23 apr 2017 anni
Indicatori delle variazioni dei valori per anni
In media:
5.587 Mille.
Minima:
2.216 Mille.
1 gen 1995 anni
Massimo:
9.049 Mille.
1 gen 2008 anni
Alla data di osservazione
Valore
Variazione assoluta
La variazione rispetto al valore precedente
1 gen 1995 anni
2.216 Mille.
+2.216 Mille.
0.0%
1 gen 1996 anni
2.423 Mille.
+207.0
9.34%
1 gen 1997 anni
2.795 Mille.
+372.0
15.35%
1 gen 1998 anni
2.866 Mille.
+71.0
2.54%
1 gen 1999 anni
3.791 Mille.
+925.0
32.27%
1 gen 2000 anni
4.208 Mille.
+417.0
11.0%
1 gen 2001 anni
5.146 Mille.
+938.0
22.29%
1 gen 2002 anni
5.52 Mille.
+374.0
7.27%
1 gen 2003 anni
5.12 Mille.
-400.0
-7.25%
1 gen 2004 anni
7.053 Mille.
+1.933 Mille.
37.75%
1 gen 2005 anni
7.751 Mille.
+698.0
9.9%
1 gen 2006 anni
8.366 Mille.
+615.0
7.93%
1 gen 2007 anni
8.449 Mille.
+83.0
0.99%
1 gen 2008 anni
9.049 Mille.
+600.0
7.1%
1 gen 2009 anni
9.049 Mille.
0.0
0.0%
Classificazione dei paesi secondo i statistiche attuali per anni