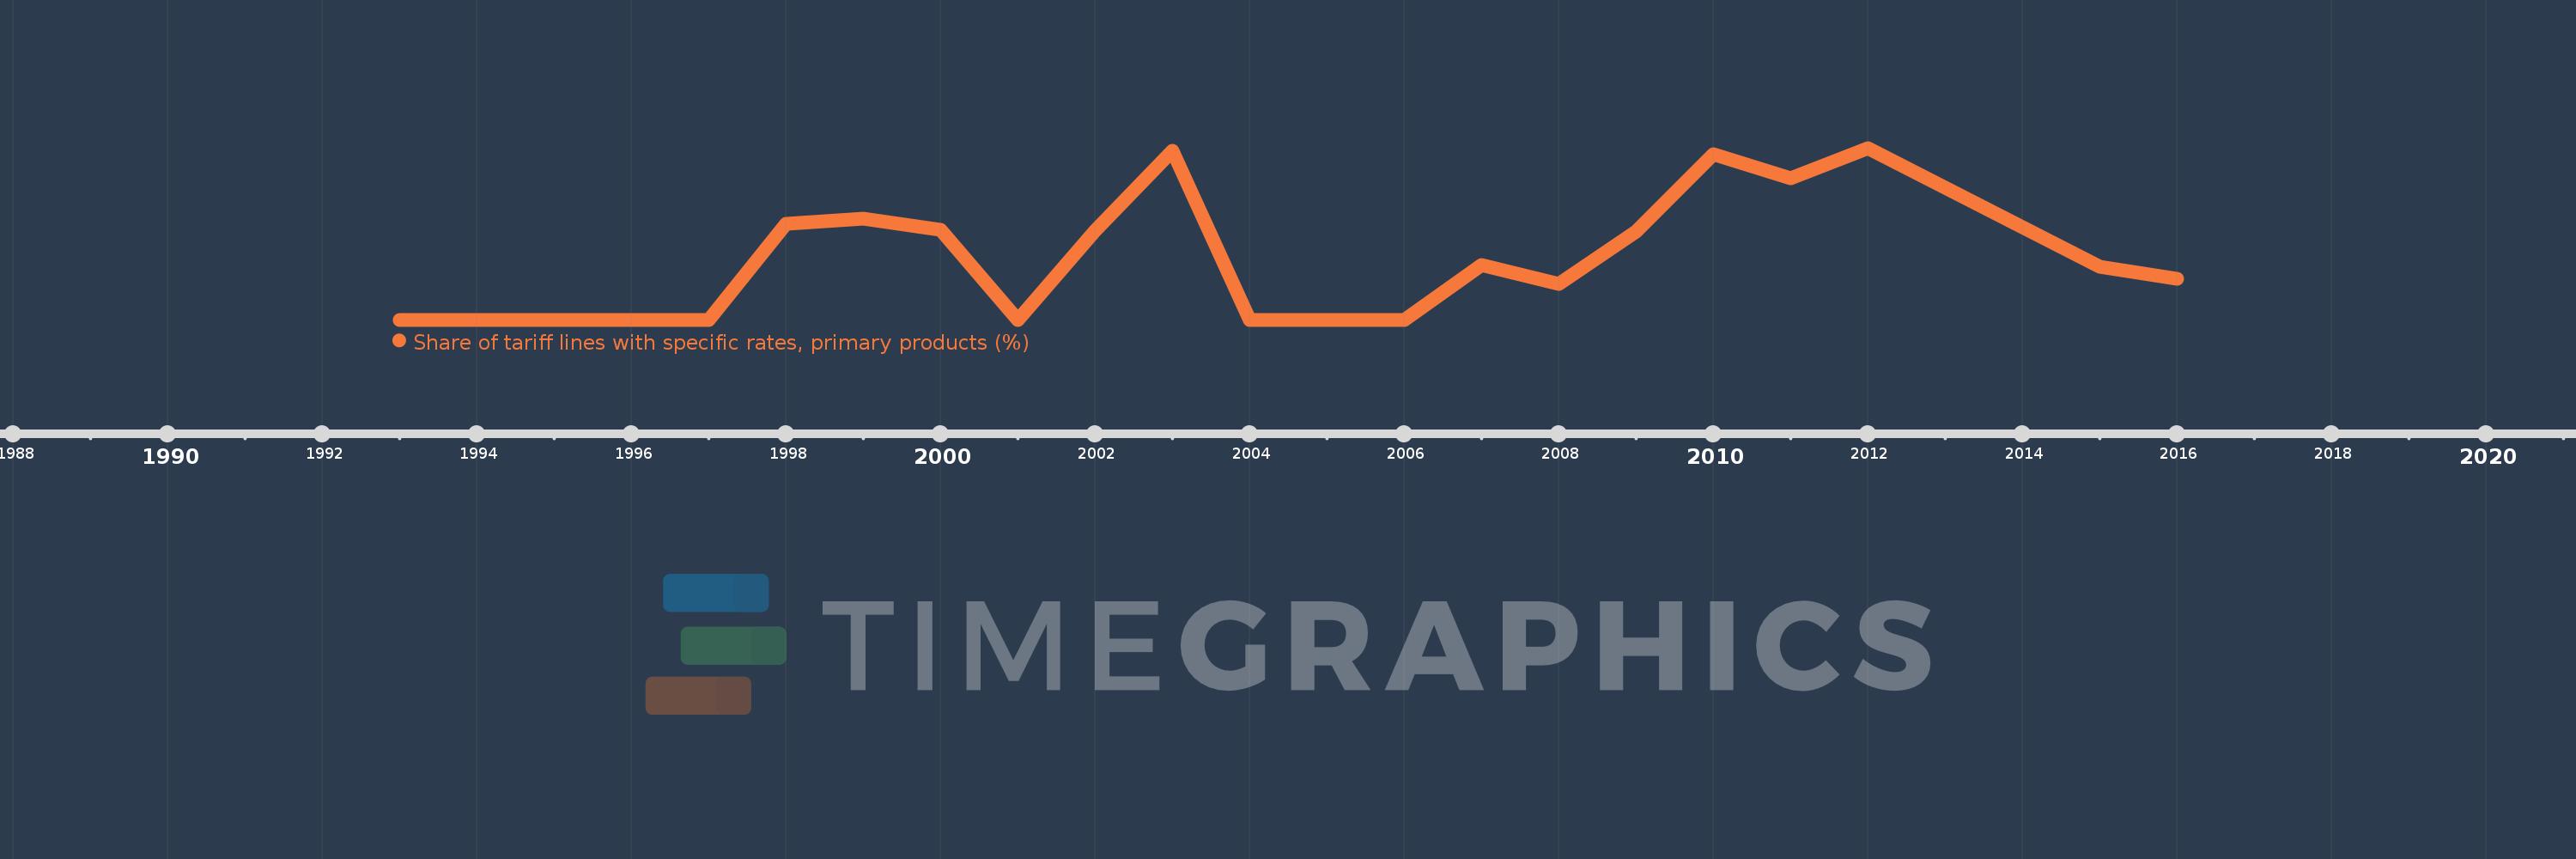
Questa scala temporale mostra un grafico dal 1993 anno al 2016 anno. China. I dati fino ad 1992 anno non disponibili. Il numero di osservazioni attuali secondo i date: 21.
La fonte (nome):
Indicatori dello sviluppo mondiale
La fonte (organizzazione):
World Bank staff estimates using the World Integrated Trade Solution system, based on data from United Nations Conference on Trade and Development's Trade Analysis and Information System (TRAINS) database.
Categorie:
Private Sector, Trade
sono stati aggiornati
23 apr 2017 anni
Indicatori delle variazioni dei valori per anni
In media:
0.224
Minima:
0.0
1 gen 1993 anni
Massimo:
0.624
1 gen 2012 anni
Alla data di osservazione
Valore
Variazione assoluta
La variazione rispetto al valore precedente
1 gen 1993 anni
0.0
0.0
0.0%
1 gen 1994 anni
0.0
0.0
%
1 gen 1995 anni
0.0
0.0
%
1 gen 1997 anni
0.0
0.0
%
1 gen 1998 anni
0.347
+0.347
%
1 gen 1999 anni
0.366
+0.019
5.45%
1 gen 2000 anni
0.327
-0.039
-10.55%
1 gen 2001 anni
0.0
-0.327
-100.0%
1 gen 2002 anni
0.323
+0.323
%
1 gen 2003 anni
0.614
+0.291
90.21%
1 gen 2004 anni
0.0
-0.614
-100.0%
1 gen 2005 anni
0.0
0.0
%
1 gen 2006 anni
0.0
0.0
%
1 gen 2007 anni
0.198
+0.198
%
1 gen 2008 anni
0.13
-0.067
-34.15%
1 gen 2009 anni
0.321
+0.191
146.57%
1 gen 2010 anni
0.601
+0.281
87.47%
1 gen 2011 anni
0.513
-0.089
-14.77%
1 gen 2012 anni
0.624
+0.111
21.75%
1 gen 2015 anni
0.192
-0.432
-69.17%
1 gen 2016 anni
0.149
-0.044
-22.72%
Classificazione dei paesi secondo i statistiche attuali per anni