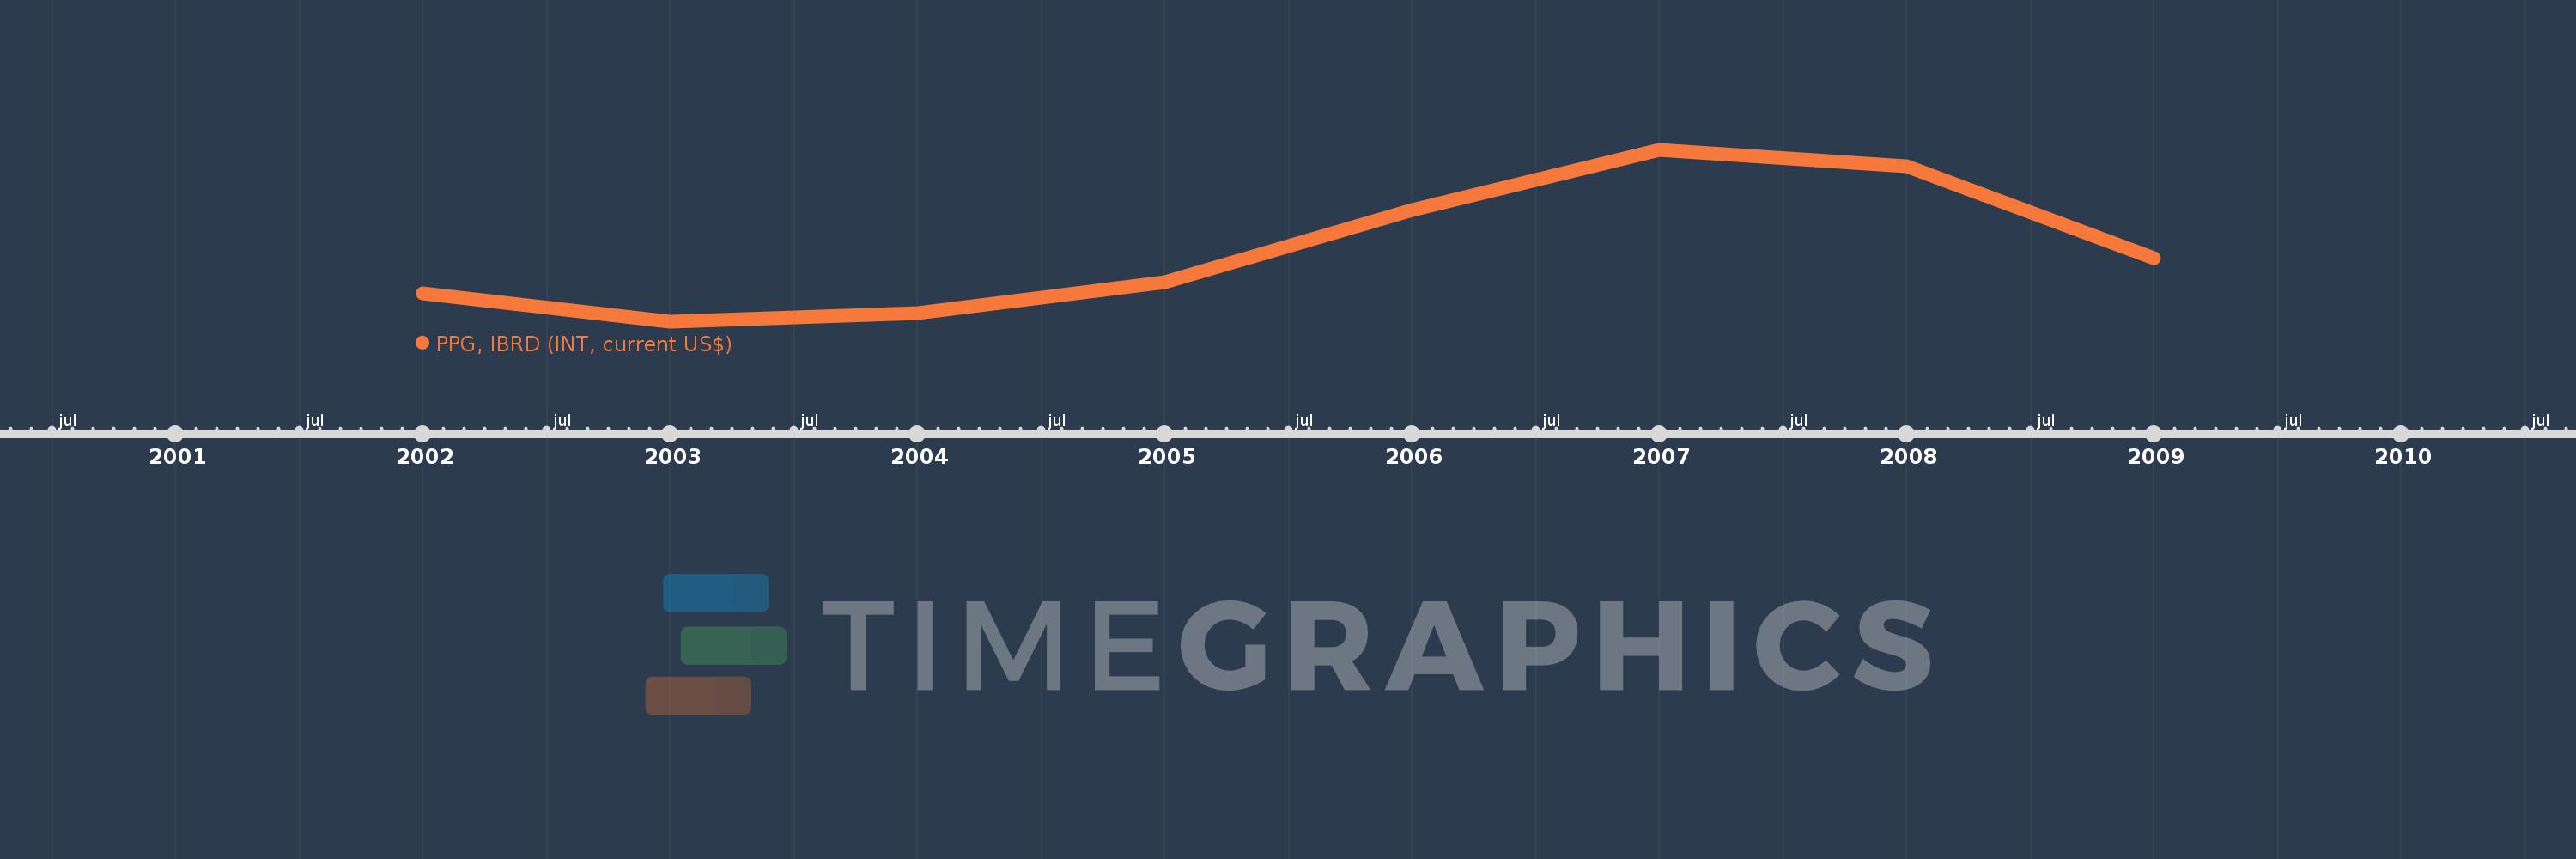
Questa scala temporale mostra un grafico dal 2002 anno al 2009 anno. Chad. I dati fino ad 2001 anno non disponibili. Il numero di osservazioni attuali secondo i date: 8.
La fonte (nome):
Indicatori dello sviluppo mondiale
La fonte (organizzazione):
World Bank, International Debt Statistics.
Categorie:
External Debt
sono stati aggiornati
23 apr 2017 anni
Indicatori delle variazioni dei valori per anni
In media:
907.75 Mille.
Minima:
276.0 Mille.
1 gen 2003 anni
Massimo:
1.772 Mln
1 gen 2007 anni
Alla data di osservazione
Valore
Variazione assoluta
La variazione rispetto al valore precedente
1 gen 2002 anni
526.0 Mille.
+526.0 Mille.
0.0%
1 gen 2003 anni
276.0 Mille.
-250.0 Mille.
-47.53%
1 gen 2004 anni
354.0 Mille.
+78.0 Mille.
28.26%
1 gen 2005 anni
619.0 Mille.
+265.0 Mille.
74.86%
1 gen 2006 anni
1.253 Mln
+634.0 Mille.
102.42%
1 gen 2007 anni
1.772 Mln
+519.0 Mille.
41.42%
1 gen 2008 anni
1.632 Mln
-140.0 Mille.
-7.9%
1 gen 2009 anni
830.0 Mille.
-802.0 Mille.
-49.14%
Classificazione dei paesi secondo i statistiche attuali per anni