29
/fr/
fr
AIzaSyAYiBZKx7MnpbEhh9jyipgxe19OcubqV5w
April 1, 2024
99242
Cambodia
KHM
true
2
1
Reserves and related items (BoP, current US$)
2015,2014,2013,2012,2011,2010,2009,2008,2007,2006,2005,2004,2003,2002,2001,2000,1999,1998,1997,1996,1995,1994,1993
Download
Bibliothèque de statistiques globales →Cambodia →

Reserves and related items (BoP, current US$)

Cette statistique dans les autres pays:
AfghanistanAlbaniaAlgeriaAngolaAntigua and BarbudaArgentinaArmeniaArubaAustraliaAustriaAzerbaijanBahamas, TheBahrainBangladeshBarbadosBelarusBelgiumBelizeBeninBermudaBhutanBoliviaBosnia and HerzegovinaBotswanaBrazilBrunei DarussalamBulgariaBurkina FasoBurundiCabo VerdeCambodiaCameroonCanadaChileChinaColombiaComorosCongo, Dem. Rep.Congo, Rep.Costa RicaCote d'IvoireCroatiaCuracaoCyprusCzech RepublicDenmarkDjiboutiDominicaDominican RepublicEcuadorEgypt, Arab Rep.El SalvadorEstoniaEthiopiaEuro areaFijiFinlandFranceFrench PolynesiaGabonGambia, TheGeorgiaGermanyGhanaGreeceGrenadaGuatemalaGuineaGuinea-BissauGuyanaHaitiHondurasHong Kong SAR, ChinaHungaryIcelandIndiaIndonesiaIraqIrelandIsraelItalyJamaicaJapanJordanKazakhstanKenyaKiribatiKorea, Rep.KosovoKuwaitKyrgyz RepublicLao PDRLatviaLebanonLesothoLiberiaLibyaLithuaniaLuxembourgMacao SAR, ChinaMacedonia, FYRMadagascarMalawiMalaysiaMaldivesMaliMaltaMarshall IslandsMauritaniaMauritiusMexicoMicronesia, Fed. Sts.MoldovaMongoliaMontenegroMoroccoMozambiqueMyanmarNamibiaNepalNetherlandsNew CaledoniaNew ZealandNicaraguaNigerNigeriaNorwayOmanPakistanPalauPanamaPapua New GuineaParaguayPeruPhilippinesPolandPortugalQatarRomaniaRussian FederationRwandaSamoaSao Tome and PrincipeSaudi ArabiaSenegalSerbiaSeychellesSierra LeoneSingaporeSint Maarten (Dutch part)Slovak RepublicSloveniaSolomon IslandsSouth AfricaSouth SudanSpainSri LankaSt. Kitts and NevisSt. LuciaSt. Vincent and the GrenadinesSudanSurinameSwazilandSwedenSwitzerlandSyrian Arab RepublicTajikistanTanzaniaThailandTimor-LesteTogoTongaTrinidad and TobagoTunisiaTurkeyTuvaluUgandaUkraineUnited KingdomUnited StatesUruguayVanuatuVenezuela, RBVietnamWest Bank and GazaYemen, Rep.ZambiaZimbabwe
La ligne de temps
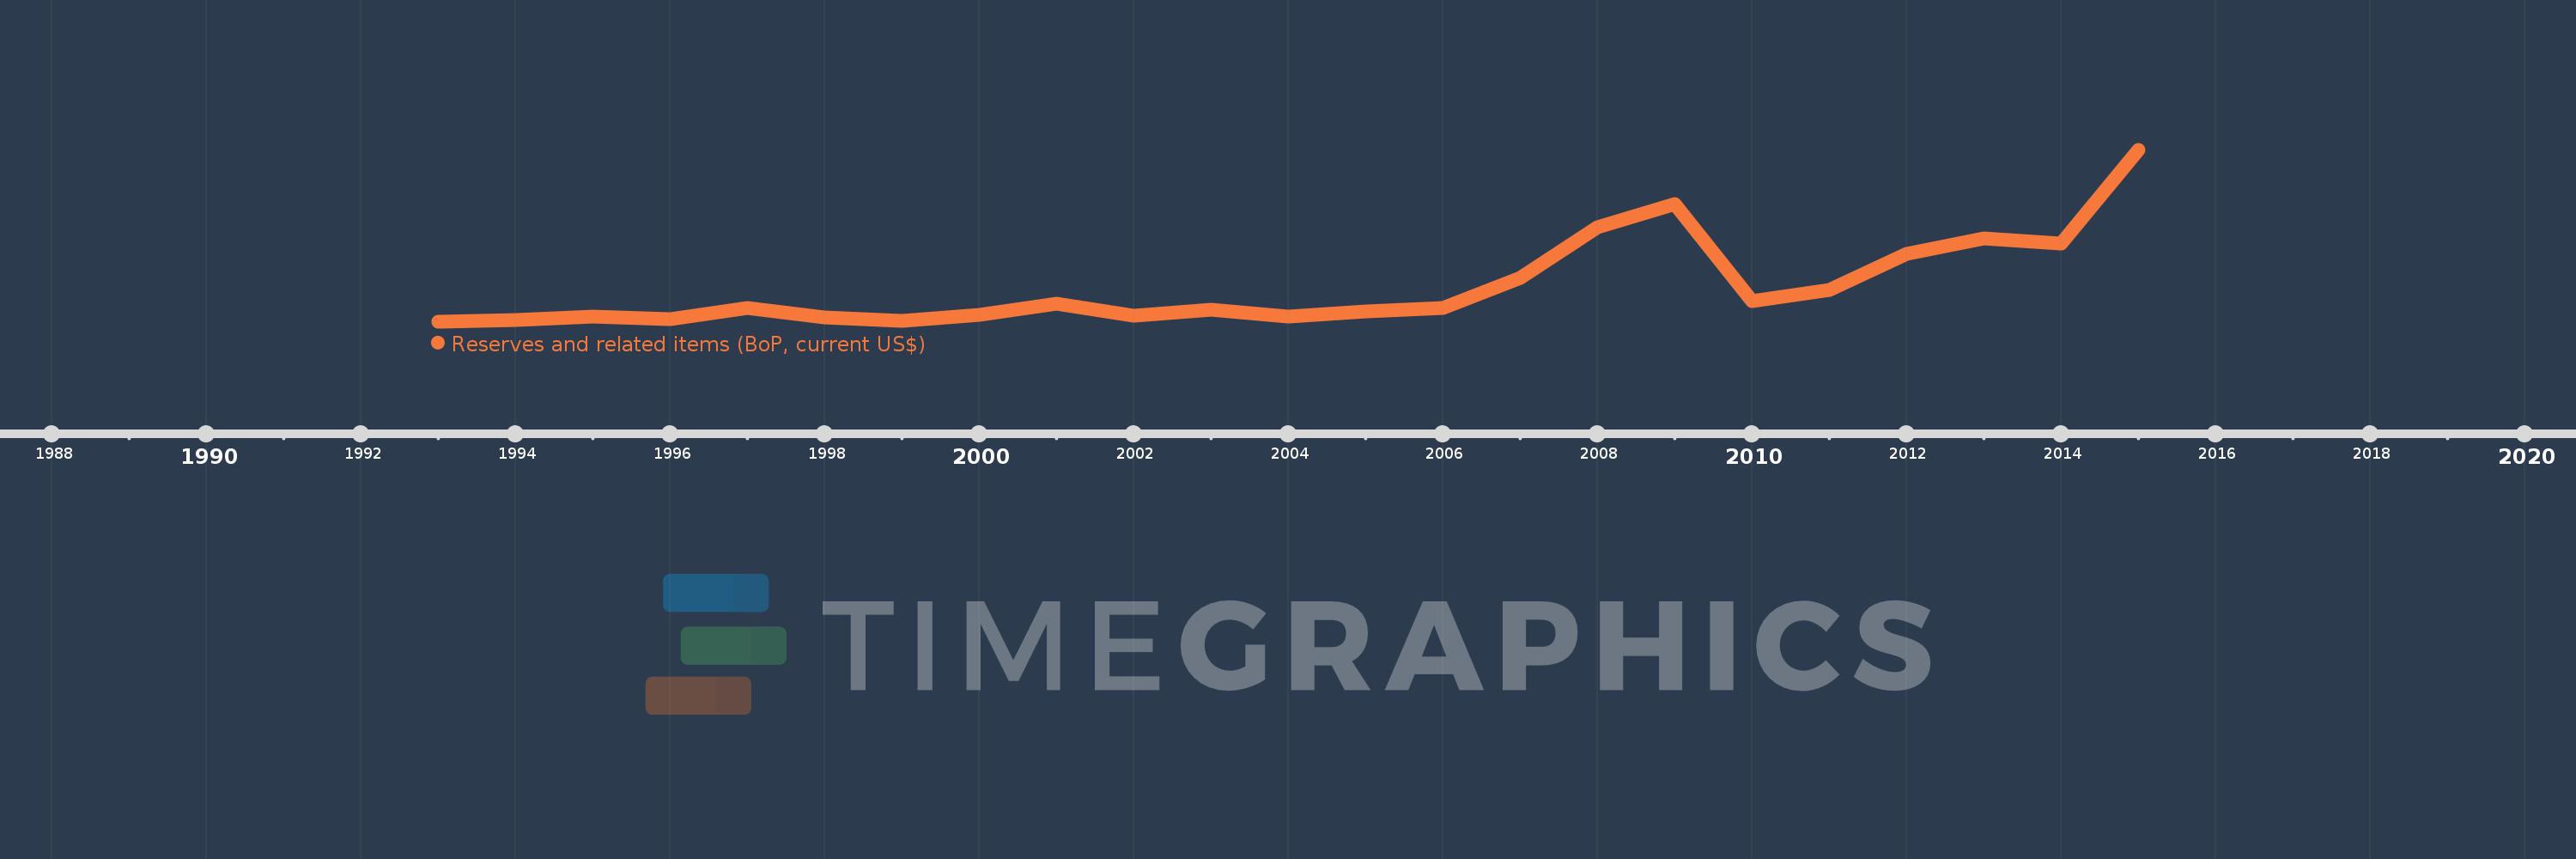
Cette échelle de temps montre un graphique de 1993 année à 2015 année Cambodia. Les données jusqu'à 1992 année ne sont pas présentés. Quantité d'observations actuelles selon dates: 23.
Source (désignation):
Les indicateurs du développement mondiale
Source (organisation):
International Monetary Fund, Balance of Payments Statistics Yearbook and data files.
Catégories:
Economy & Growth
Dernière mise à jour
23 avr. 2017
Les indicateurs de changement de valeurs selon les années
En moyenne:
166.437 mln.
Minimum:
13.158 mln.
1 janv. 1993
Maximum:
754.387 mln.
1 janv. 2015
Pour la date d''observation
Valeur
Changement absolu
Le changement par rapport à la valeur précédente
1 janv. 1993
13.158 mln.
+13.158 mln.
0.0%
1 janv. 1994
20.766 mln.
+7.608 mln.
57.82%
1 janv. 1995
36.231 mln.
+15.466 mln.
74.48%
1 janv. 1996
26.203 mln.
-10.029 mln.
-27.68%
1 janv. 1997
71.983 mln.
+45.78 mln.
174.72%
1 janv. 1998
33.88 mln.
-38.103 mln.
-52.93%
1 janv. 1999
18.743 mln.
-15.137 mln.
-44.68%
1 janv. 2000
44.791 mln.
+26.048 mln.
138.97%
1 janv. 2001
91.967 mln.
+47.176 mln.
105.32%
1 janv. 2002
41.923 mln.
-50.044 mln.
-54.42%
1 janv. 2003
67.35 mln.
+25.427 mln.
60.65%
1 janv. 2004
36.453 mln.
-30.897 mln.
-45.88%
1 janv. 2005
58.487 mln.
+22.035 mln.
60.45%
1 janv. 2006
74.457 mln.
+15.97 mln.
27.31%
1 janv. 2007
203.127 mln.
+128.67 mln.
172.81%
1 janv. 2008
423.241 mln.
+220.114 mln.
108.36%
1 janv. 2009
522.437 mln.
+99.196 mln.
23.44%
1 janv. 2010
102.238 mln.
-420.199 mln.
-80.43%
1 janv. 2011
150.278 mln.
+48.04 mln.
46.99%
1 janv. 2012
308.735 mln.
+158.457 mln.
105.44%
1 janv. 2013
375.411 mln.
+66.676 mln.
21.6%
1 janv. 2014
351.806 mln.
-23.605 mln.
-6.29%
1 janv. 2015
754.387 mln.
+402.581 mln.
114.43%
Classement des pays selon les statistiques actuelles par années

Commentaires:

Envoyer
PremiumAbout & FeedbackUn accordConfidentialité
logo
© 2022 Selected Technologies LLC – Morgan Hill, California