33
/fr/
AIzaSyAYiBZKx7MnpbEhh9jyipgxe19OcubqV5w
August 1, 2025
175815
Latvia
LVA
true
2
1
Reserves and related items (BoP, current US$)
2016,2015,2014,2013,2012,2011,2010,2009,2008,2007,2006,2005,2004,2003,2002,2001,2000,1999,1998,1997,1996,1995,1994,1993
Download
Bibliothèque de statistiques globales →Latvia →

Reserves and related items (BoP, current US$)

Cette statistique dans les autres pays:

AfghanistanAlbaniaAlgeriaAngolaAntigua and BarbudaArgentinaArmeniaArubaAustraliaAustriaAzerbaijanBahamas, TheBahrainBangladeshBarbadosBelarusBelgiumBelizeBeninBermudaBhutanBoliviaBosnia and HerzegovinaBotswanaBrazilBrunei DarussalamBulgariaBurkina FasoBurundiCabo VerdeCambodiaCameroonCanadaChileChinaColombiaComorosCongo, Dem. Rep.Congo, Rep.Costa RicaCote d'IvoireCroatiaCuracaoCyprusCzech RepublicDenmarkDjiboutiDominicaDominican RepublicEcuadorEgypt, Arab Rep.El SalvadorEstoniaEthiopiaEuro areaFijiFinlandFranceFrench PolynesiaGabonGambia, TheGeorgiaGermanyGhanaGreeceGrenadaGuatemalaGuineaGuinea-BissauGuyanaHaitiHondurasHong Kong SAR, ChinaHungaryIcelandIndiaIndonesiaIraqIrelandIsraelItalyJamaicaJapanJordanKazakhstanKenyaKiribatiKorea, Rep.KosovoKuwaitKyrgyz RepublicLao PDRLatviaLebanonLesothoLiberiaLibyaLithuaniaLuxembourgMacao SAR, ChinaMacedonia, FYRMadagascarMalawiMalaysiaMaldivesMaliMaltaMarshall IslandsMauritaniaMauritiusMexicoMicronesia, Fed. Sts.MoldovaMongoliaMontenegroMoroccoMozambiqueMyanmarNamibiaNepalNetherlandsNew CaledoniaNew ZealandNicaraguaNigerNigeriaNorwayOmanPakistanPalauPanamaPapua New GuineaParaguayPeruPhilippinesPolandPortugalQatarRomaniaRussian FederationRwandaSamoaSao Tome and PrincipeSaudi ArabiaSenegalSerbiaSeychellesSierra LeoneSingaporeSint Maarten (Dutch part)Slovak RepublicSloveniaSolomon IslandsSouth AfricaSouth SudanSpainSri LankaSt. Kitts and NevisSt. LuciaSt. Vincent and the GrenadinesSudanSurinameSwazilandSwedenSwitzerlandSyrian Arab RepublicTajikistanTanzaniaThailandTimor-LesteTogoTongaTrinidad and TobagoTunisiaTurkeyTuvaluUgandaUkraineUnited KingdomUnited StatesUruguayVanuatuVenezuela, RBVietnamWest Bank and GazaYemen, Rep.ZambiaZimbabwe

La ligne de temps

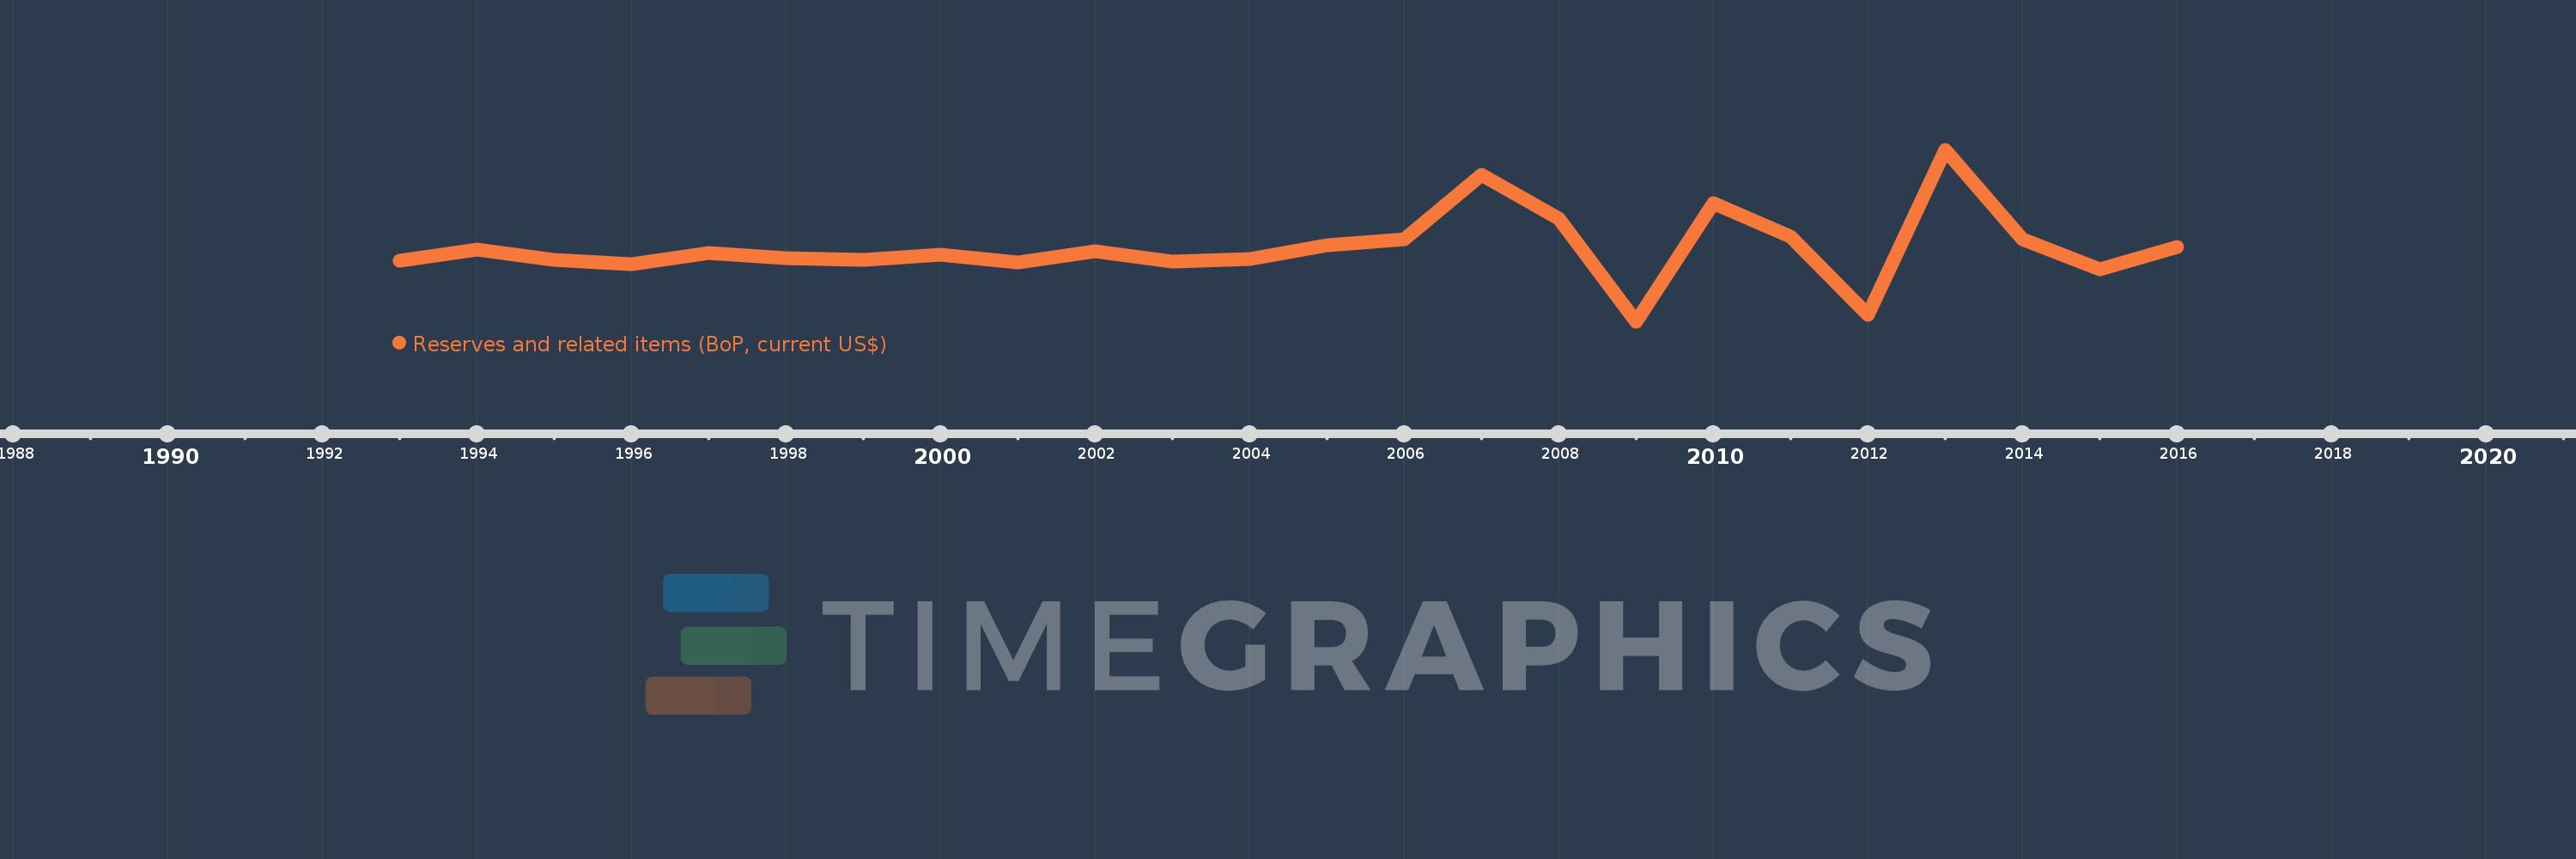
Cette échelle de temps montre un graphique de 1993 année à 2016 année Latvia. Les données jusqu'à 1992 année ne sont pas présentés. Quantité d'observations actuelles selon dates: 24.

Source (désignation):

Les indicateurs du développement mondiale

Source (organisation):

International Monetary Fund, Balance of Payments Statistics Yearbook and data files.

Catégories:

Economy & Growth

Dernière mise à jour

23 avr. 2017

Les indicateurs de changement de valeurs selon les années

En moyenne:
322.077 mln.
Minimum:
-1.352 mds
1 janv. 2009
Maximum:
2.539 mds
1 janv. 2013
Pour la date d''observation
Valeur
Changement absolu
Le changement par rapport à la valeur précédente
1 janv. 1993
37.492 mln.
+37.492 mln.
0.0%
1 janv. 1994
297.618 mln.
+260.126 mln.
693.82%
1 janv. 1995
56.54 mln.
-241.078 mln.
-81.0%
1 janv. 1996
-33.208 mln.
-89.748 mln.
-158.73%
1 janv. 1997
211.055 mln.
+244.263 mln.
-735.56%
1 janv. 1998
102.151 mln.
-108.904 mln.
-51.6%
1 janv. 1999
62.636 mln.
-39.516 mln.
-38.68%
1 janv. 2000
164.986 mln.
+102.35 mln.
163.41%
1 janv. 2001
2.825 mln.
-162.162 mln.
-98.29%
1 janv. 2002
254.875 mln.
+252.051 mln.
8.92 milles%
1 janv. 2003
13.197 mln.
-241.678 mln.
-94.82%
1 janv. 2004
78.98 mln.
+65.783 mln.
498.46%
1 janv. 2005
385.178 mln.
+306.198 mln.
387.69%
1 janv. 2006
524.987 mln.
+139.809 mln.
36.3%
1 janv. 2007
1.977 mds
+1.452 mds
276.56%
1 janv. 2008
984.487 mln.
-992.401 mln.
-50.2%
1 janv. 2009
-1.352 mds
-2.337 mds
-237.34%
1 janv. 2010
1.33 mds
+2.682 mds
-198.35%
1 janv. 2011
578.762 mln.
-751.069 mln.
-56.48%
1 janv. 2012
-1.2 mds
-1.779 mds
-307.3%
1 janv. 2013
2.539 mds
+3.739 mds
-311.61%
1 janv. 2014
520.451 mln.
-2.018 mds
-79.5%
1 janv. 2015
-154.643 mln.
-675.094 mln.
-129.71%
1 janv. 2016
347.738 mln.
+502.381 mln.
-324.87%

Classement des pays selon les statistiques actuelles par années