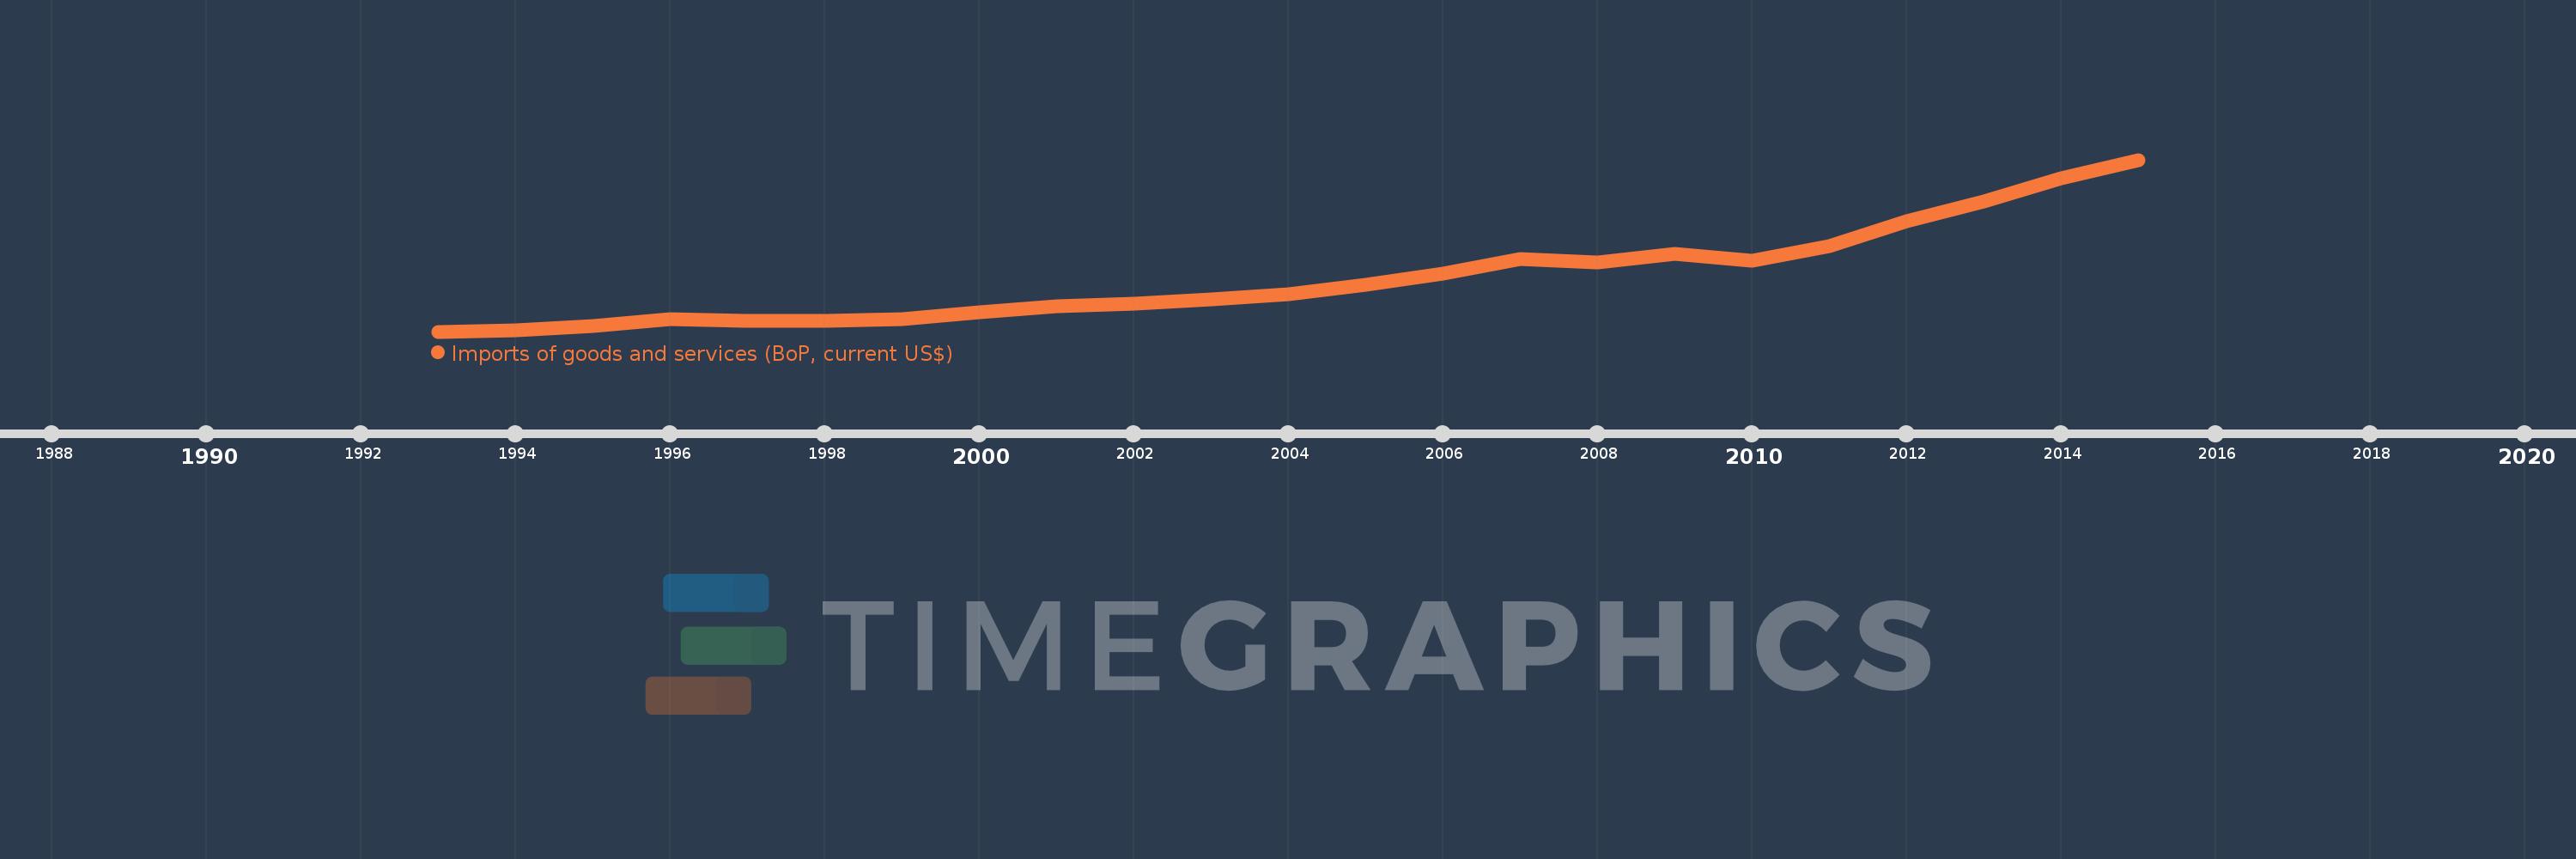
Cette échelle de temps montre un graphique de 1993 année à 2015 année Cambodia. Les données jusqu'à 1992 année ne sont pas présentés. Quantité d'observations actuelles selon dates: 23.
Source (désignation):
Les indicateurs du développement mondiale
Source (organisation):
International Monetary Fund, Balance of Payments Statistics Yearbook and data files.
Catégories:
Economy & Growth, Trade
Dernière mise à jour
23 avr. 2017
Les indicateurs de changement de valeurs selon les années
En moyenne:
4.285 mds
Minimum:
507.0 mln.
1 janv. 1993
Maximum:
12.551 mds
1 janv. 2015
Pour la date d''observation
Valeur
Changement absolu
Le changement par rapport à la valeur précédente
1 janv. 1993
507.0 mln.
+507.0 mln.
0.0%
1 janv. 1994
591.57 mln.
+84.57 mln.
16.68%
1 janv. 1995
884.0 mln.
+292.43 mln.
49.43%
1 janv. 1996
1.375 mds
+490.7 mln.
55.51%
1 janv. 1997
1.287 mds
-88.1 mln.
-6.41%
1 janv. 1998
1.252 mds
-34.6 mln.
-2.69%
1 janv. 1999
1.386 mds
+134.294 mln.
10.73%
1 janv. 2000
1.884 mds
+497.271 mln.
35.87%
1 janv. 2001
2.263 mds
+379.689 mln.
20.16%
1 janv. 2002
2.441 mds
+178.05 mln.
7.87%
1 janv. 2003
2.736 mds
+294.761 mln.
12.07%
1 janv. 2004
3.102 mds
+365.914 mln.
13.37%
1 janv. 2005
3.784 mds
+681.907 mln.
21.98%
1 janv. 2006
4.574 mds
+790.288 mln.
20.89%
1 janv. 2007
5.581 mds
+1.007 mds
22.02%
1 janv. 2008
5.335 mds
-246.11 mln.
-4.41%
1 janv. 2009
5.977 mds
+641.619 mln.
12.03%
1 janv. 2010
5.455 mds
-521.762 mln.
-8.73%
1 janv. 2011
6.472 mds
+1.017 mds
18.64%
1 janv. 2012
8.252 mds
+1.779 mds
27.49%
1 janv. 2013
9.624 mds
+1.372 mds
16.63%
1 janv. 2014
11.246 mds
+1.622 mds
16.85%
1 janv. 2015
12.551 mds
+1.305 mds
11.6%
Classement des pays selon les statistiques actuelles par années