29
/fr/
fr
AIzaSyAYiBZKx7MnpbEhh9jyipgxe19OcubqV5w
April 1, 2024
103724
Chad
TCD
true
2
1
Imports of goods and services (BoP, current US$)
1995,1994,1993,1992,1991,1990,1989,1988,1987,1986,1985,1984,1983,1982,1981,1980,1979,1978
Download
Bibliothèque de statistiques globales →Chad →

Imports of goods and services (BoP, current US$)

Cette statistique dans les autres pays:
AfghanistanAlbaniaAlgeriaAngolaAntigua and BarbudaArab WorldArgentinaArmeniaArubaAustraliaAustriaAzerbaijanBahamas, TheBahrainBangladeshBarbadosBelarusBelgiumBelizeBeninBermudaBhutanBoliviaBosnia and HerzegovinaBotswanaBrazilBrunei DarussalamBulgariaBurkina FasoBurundiCabo VerdeCambodiaCameroonCanadaCaribbean small statesCentral African RepublicCentral Europe and the BalticsChadChileChinaColombiaComorosCongo, Dem. Rep.Congo, Rep.Costa RicaCote d'IvoireCroatiaCuracaoCyprusCzech RepublicDenmarkDjiboutiDominicaDominican RepublicEarly-demographic dividendEast Asia & PacificEast Asia & Pacific (excluding high income)East Asia & Pacific (IDA & IBRD countries)EcuadorEgypt, Arab Rep.El SalvadorEquatorial GuineaEritreaEstoniaEthiopiaEuro areaEurope & Central AsiaEurope & Central Asia (excluding high income)Europe & Central Asia (IDA & IBRD countries)European UnionFaroe IslandsFijiFinlandFragile and conflict affected situationsFranceFrench PolynesiaGabonGambia, TheGeorgiaGermanyGhanaGreeceGrenadaGuatemalaGuineaGuinea-BissauGuyanaHaitiHeavily indebted poor countries (HIPC)High incomeHondurasHong Kong SAR, ChinaHungaryIBRD onlyIcelandIDA & IBRD totalIDA blendIDA onlyIDA totalIndiaIndonesiaIran, Islamic Rep.IraqIrelandIsraelItalyJamaicaJapanJordanKazakhstanKenyaKiribatiKorea, Rep.KosovoKuwaitKyrgyz RepublicLao PDRLate-demographic dividendLatin America & Caribbean Latin America & Caribbean (excluding high income)Latin America & the Caribbean (IDA & IBRD countries)LatviaLeast developed countries: UN classificationLebanonLesothoLiberiaLibyaLithuaniaLow & middle incomeLow incomeLower middle incomeLuxembourgMacao SAR, ChinaMacedonia, FYRMadagascarMalawiMalaysiaMaldivesMaliMaltaMarshall IslandsMauritaniaMauritiusMexicoMicronesia, Fed. Sts.Middle East & North Africa (excluding high income)Middle East & North Africa (IDA & IBRD countries)Middle incomeMoldovaMongoliaMontenegroMoroccoMozambiqueMyanmarNamibiaNepalNetherlandsNew CaledoniaNicaraguaNigerNigeriaNorth AmericaNorwayOECD membersOmanOther small statesPacific island small statesPakistanPalauPanamaPapua New GuineaParaguayPeruPhilippinesPolandPortugalPost-demographic dividendPre-demographic dividendQatarRomaniaRussian FederationRwandaSamoaSao Tome and PrincipeSaudi ArabiaSenegalSerbiaSeychellesSierra LeoneSingaporeSint Maarten (Dutch part)Slovak RepublicSloveniaSmall statesSolomon IslandsSouth AfricaSouth AsiaSouth Asia (IDA & IBRD)South SudanSpainSri LankaSt. Kitts and NevisSt. LuciaSt. Vincent and the GrenadinesSub-Saharan Africa Sub-Saharan Africa (excluding high income)Sub-Saharan Africa (IDA & IBRD countries)SudanSurinameSwazilandSwedenSwitzerlandSyrian Arab RepublicTajikistanTanzaniaThailandTimor-LesteTogoTongaTrinidad and TobagoTunisiaTurkeyTuvaluUgandaUkraineUnited KingdomUnited StatesUpper middle incomeUruguayVanuatuVenezuela, RBVietnamWest Bank and GazaWorldYemen, Rep.ZambiaZimbabwe
La ligne de temps
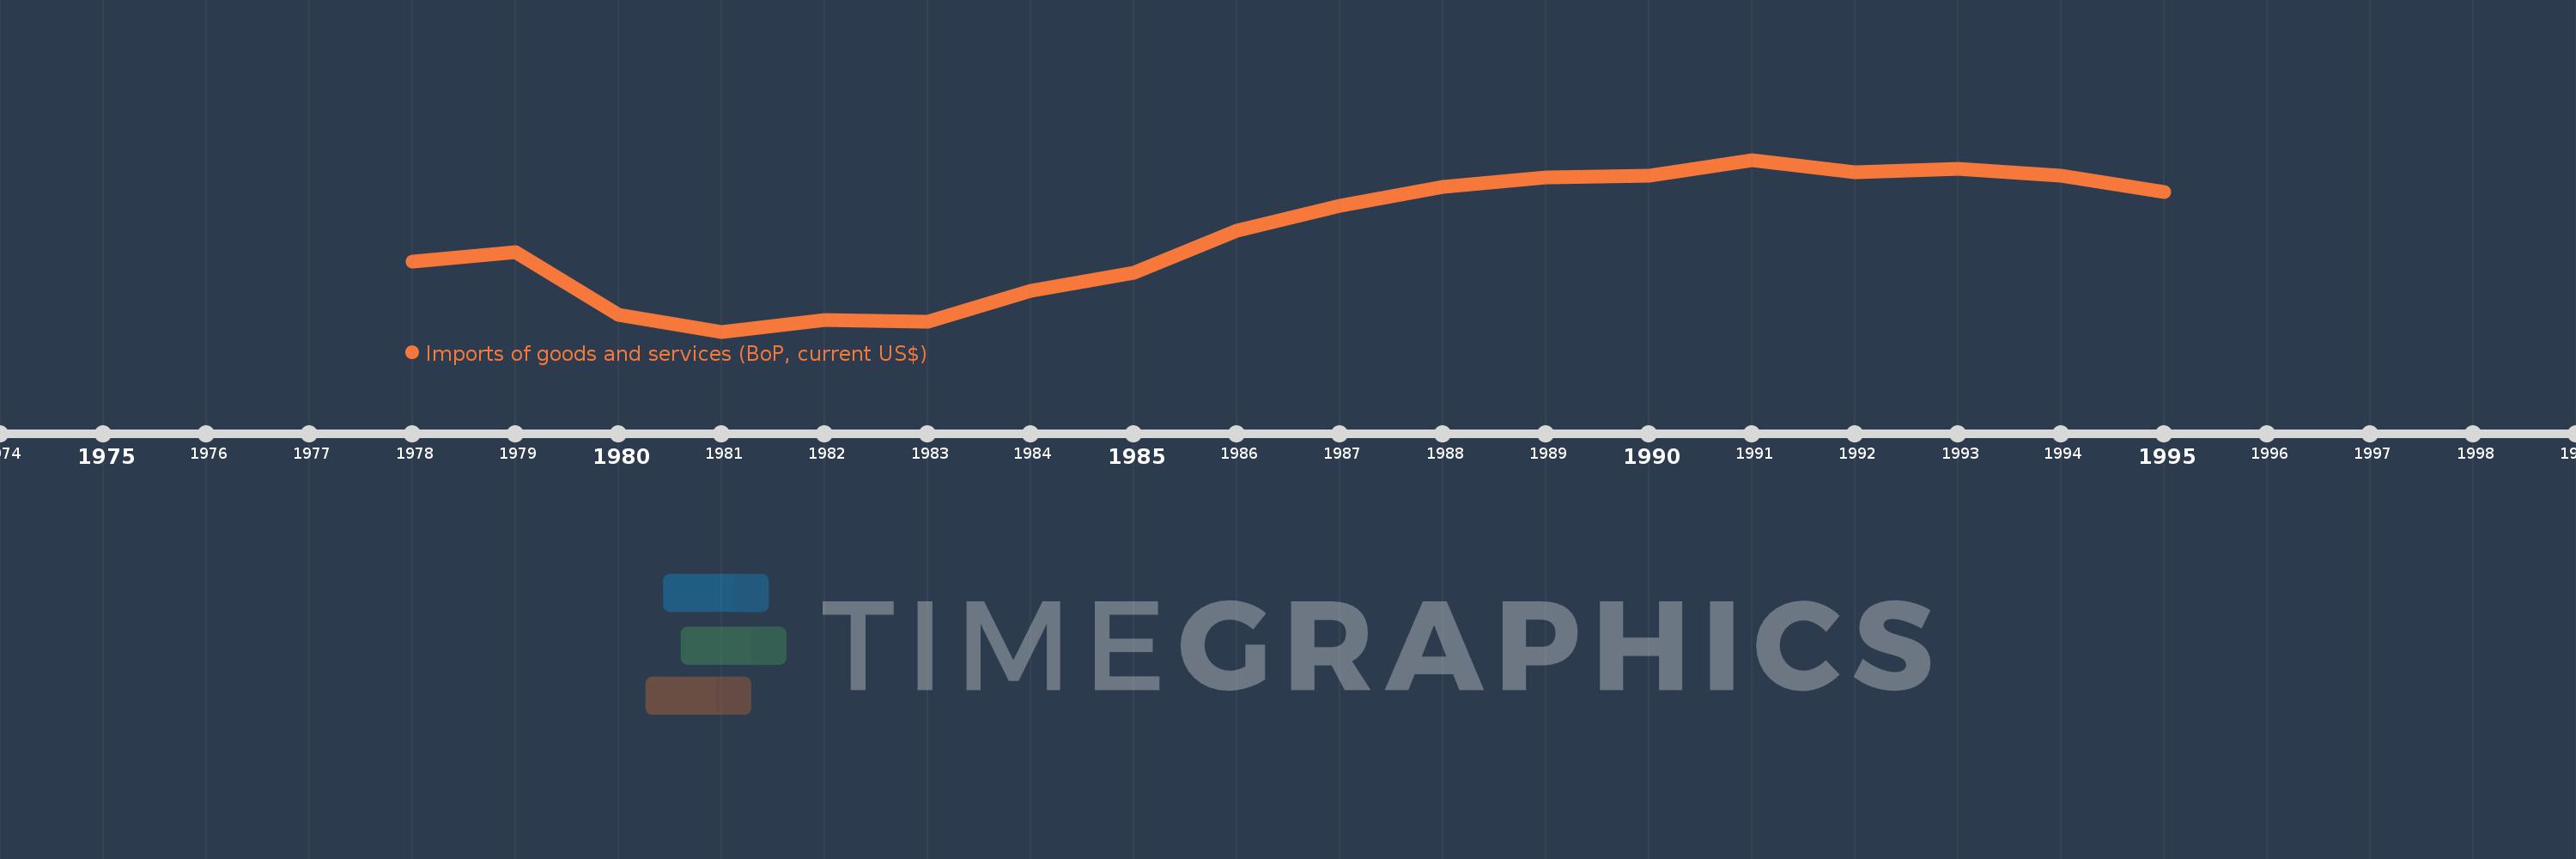
Cette échelle de temps montre un graphique de 1978 année à 1995 année Chad. Les données jusqu'à 1977 année ne sont pas présentés. Quantité d'observations actuelles selon dates: 18.
Source (désignation):
Les indicateurs du développement mondiale
Source (organisation):
International Monetary Fund, Balance of Payments Statistics Yearbook and data files.
Catégories:
Economy & Growth, Trade
Dernière mise à jour
23 avr. 2017
Les indicateurs de changement de valeurs selon les années
En moyenne:
311.634 mln.
Minimum:
79.482 mln.
1 janv. 1981
Maximum:
487.65 mln.
1 janv. 1991
Pour la date d''observation
Valeur
Changement absolu
Le changement par rapport à la valeur précédente
1 janv. 1978
245.621 mln.
+245.621 mln.
0.0%
1 janv. 1979
267.514 mln.
+21.893 mln.
8.91%
1 janv. 1980
118.502 mln.
-149.011 mln.
-55.7%
1 janv. 1981
79.482 mln.
-39.02 mln.
-32.93%
1 janv. 1982
106.532 mln.
+27.049 mln.
34.03%
1 janv. 1983
103.775 mln.
-2.757 mln.
-2.59%
1 janv. 1984
176.752 mln.
+72.977 mln.
70.32%
1 janv. 1985
218.402 mln.
+41.65 mln.
23.56%
1 janv. 1986
320.147 mln.
+101.745 mln.
46.59%
1 janv. 1987
377.753 mln.
+57.606 mln.
17.99%
1 janv. 1988
423.865 mln.
+46.113 mln.
12.21%
1 janv. 1989
446.325 mln.
+22.459 mln.
5.3%
1 janv. 1990
450.258 mln.
+3.933 mln.
0.88%
1 janv. 1991
487.65 mln.
+37.392 mln.
8.3%
1 janv. 1992
457.887 mln.
-29.764 mln.
-6.1%
1 janv. 1993
467.14 mln.
+9.253 mln.
2.02%
1 janv. 1994
450.338 mln.
-16.801 mln.
-3.6%
1 janv. 1995
411.47 mln.
-38.869 mln.
-8.63%
Classement des pays selon les statistiques actuelles par années

Commentaires:

Envoyer
PremiumAbout & FeedbackUn accordConfidentialité
logo
© 2022 Selected Technologies LLC – Morgan Hill, California