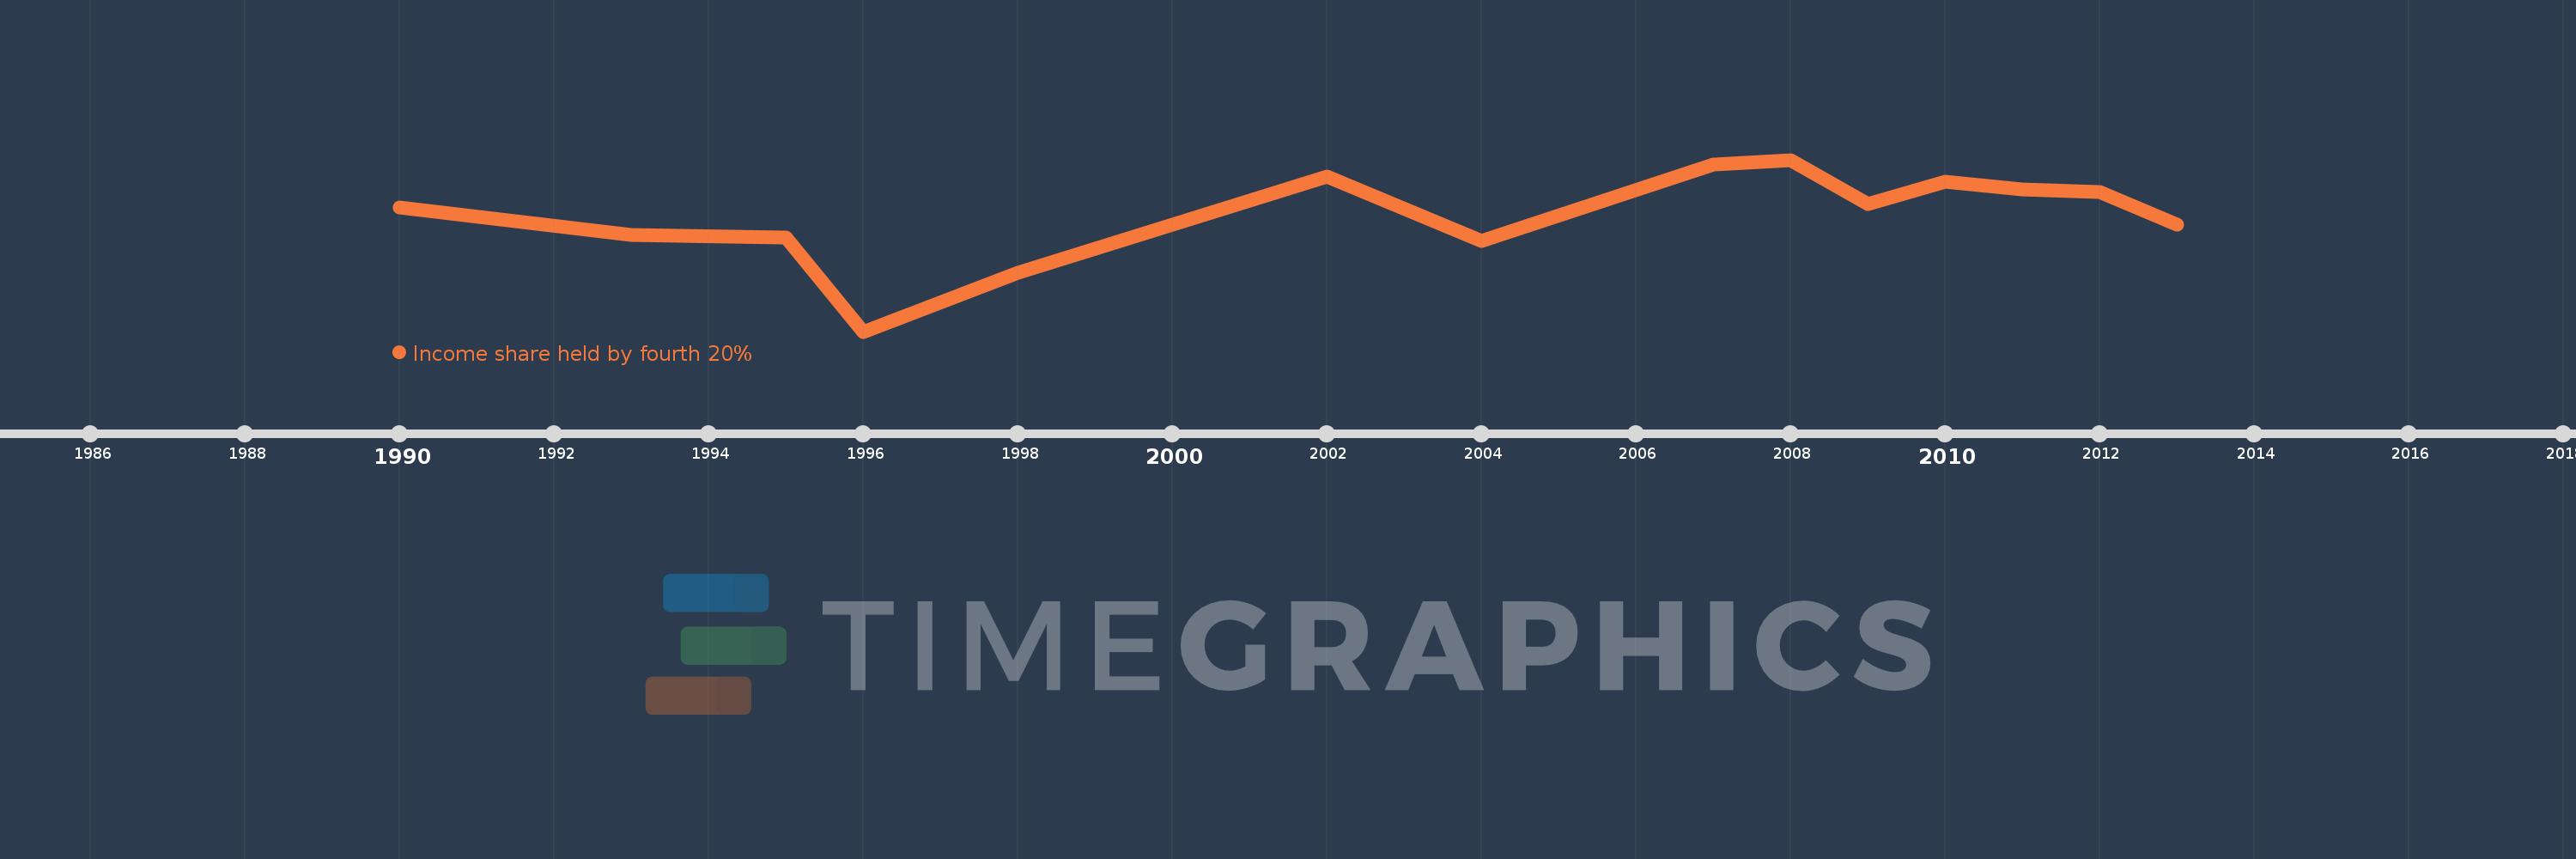
Cette échelle de temps montre un graphique de 1990 année à 2013 année Bulgaria. Les données jusqu'à 1989 année ne sont pas présentés. Quantité d'observations actuelles selon dates: 14.
Source (désignation):
Les indicateurs du développement mondiale
Source (organisation):
World Bank, Development Research Group. Data are based on primary household survey data obtained from government statistical agencies and World Bank country departments. Data for high-income economies are from the Luxembourg Income Study database. For more information and methodology, please see PovcalNet (http://iresearch.worldbank.org/PovcalNet/index.htm).
Catégories:
Poverty
Dernière mise à jour
23 avr. 2017
Les indicateurs de changement de valeurs selon les années
En moyenne:
22.441
Minimum:
21.28
1 janv. 1996
Maximum:
23.0
1 janv. 2008
Pour la date d''observation
Valeur
Changement absolu
Le changement par rapport à la valeur précédente
1 janv. 1990
22.52
+22.52
0.0%
1 janv. 1993
22.25
-0.27
-1.2%
1 janv. 1995
22.22
-0.03
-0.13%
1 janv. 1996
21.28
-0.94
-4.23%
1 janv. 1998
21.87
+0.59
2.77%
1 janv. 2002
22.83
+0.96
4.39%
1 janv. 2004
22.19
-0.64
-2.8%
1 janv. 2007
22.95
+0.76
3.42%
1 janv. 2008
23.0
+0.05
0.22%
1 janv. 2009
22.56
-0.44
-1.91%
1 janv. 2010
22.78
+0.22
0.98%
1 janv. 2011
22.7
-0.08
-0.35%
1 janv. 2012
22.68
-0.02
-0.09%
1 janv. 2013
22.35
-0.33
-1.46%
Classement des pays selon les statistiques actuelles par années