Download Cette statistique dans les autres pays:
La ligne de temps
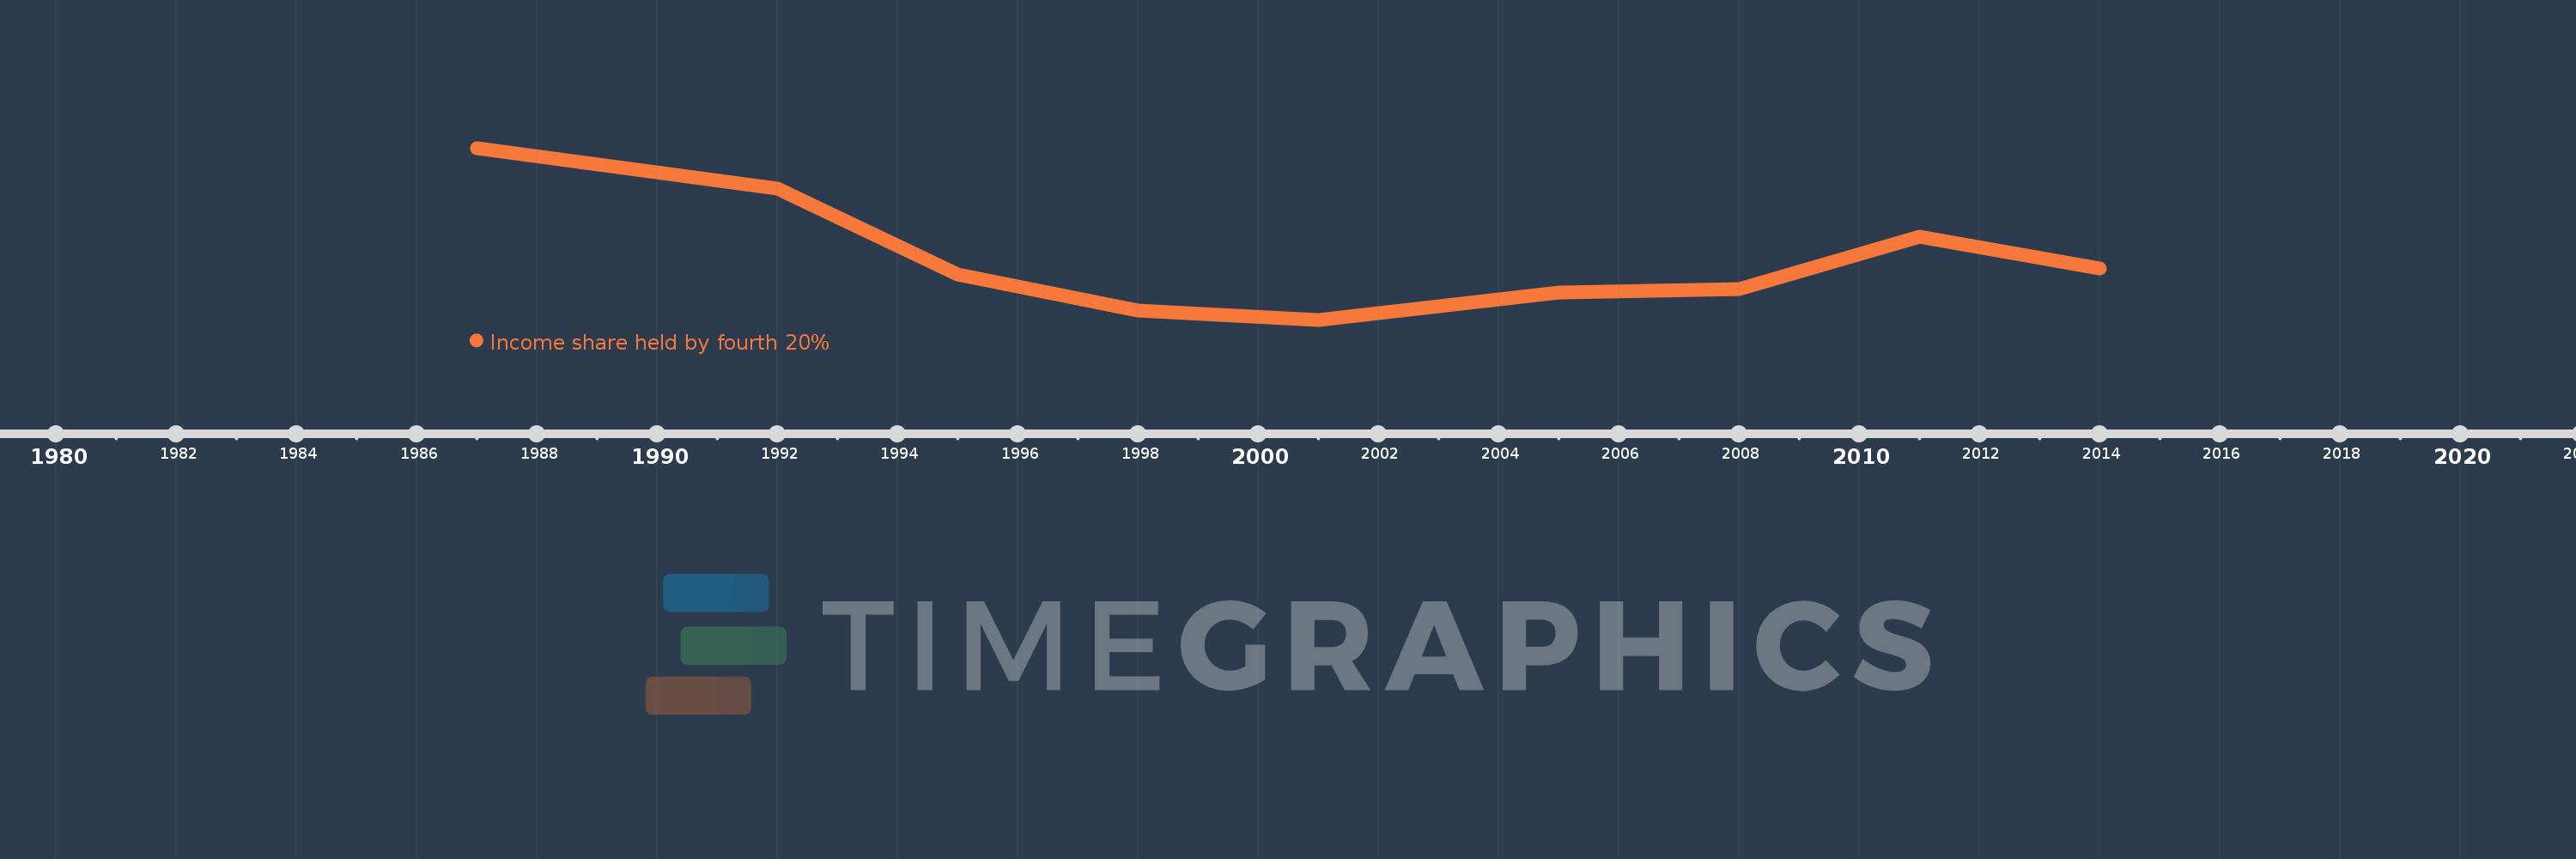
Cette échelle de temps montre un graphique de 1987 année à 2014 année United States. Les données jusqu'à 1986 année ne sont pas présentés. Quantité d'observations actuelles selon dates: 9.
Source (désignation):
Les indicateurs du développement mondiale
Source (organisation):
World Bank, Development Research Group. Data are based on primary household survey data obtained from government statistical agencies and World Bank country departments. Data for high-income economies are from the Luxembourg Income Study database. For more information and methodology, please see PovcalNet (http://iresearch.worldbank.org/PovcalNet/index.htm).
Catégories:
Poverty
Dernière mise à jour
23 avr. 2017
Les indicateurs de changement de valeurs selon les années
Minimum:
22.31
1 janv. 2001
Maximum:
23.65
1 janv. 1987
Pour la date d''observation
Valeur
Changement absolu
Le changement par rapport à la valeur précédente
1 janv. 1987
23.65
+23.65
0.0%
1 janv. 1992
23.33
-0.32
-1.35%
1 janv. 1995
22.66
-0.67
-2.87%
1 janv. 1998
22.38
-0.28
-1.24%
1 janv. 2001
22.31
-0.07
-0.31%
1 janv. 2005
22.52
+0.21
0.94%
1 janv. 2008
22.55
+0.03
0.13%
1 janv. 2011
22.96
+0.41
1.82%
1 janv. 2014
22.71
-0.25
-1.09%
Classement des pays selon les statistiques actuelles par années