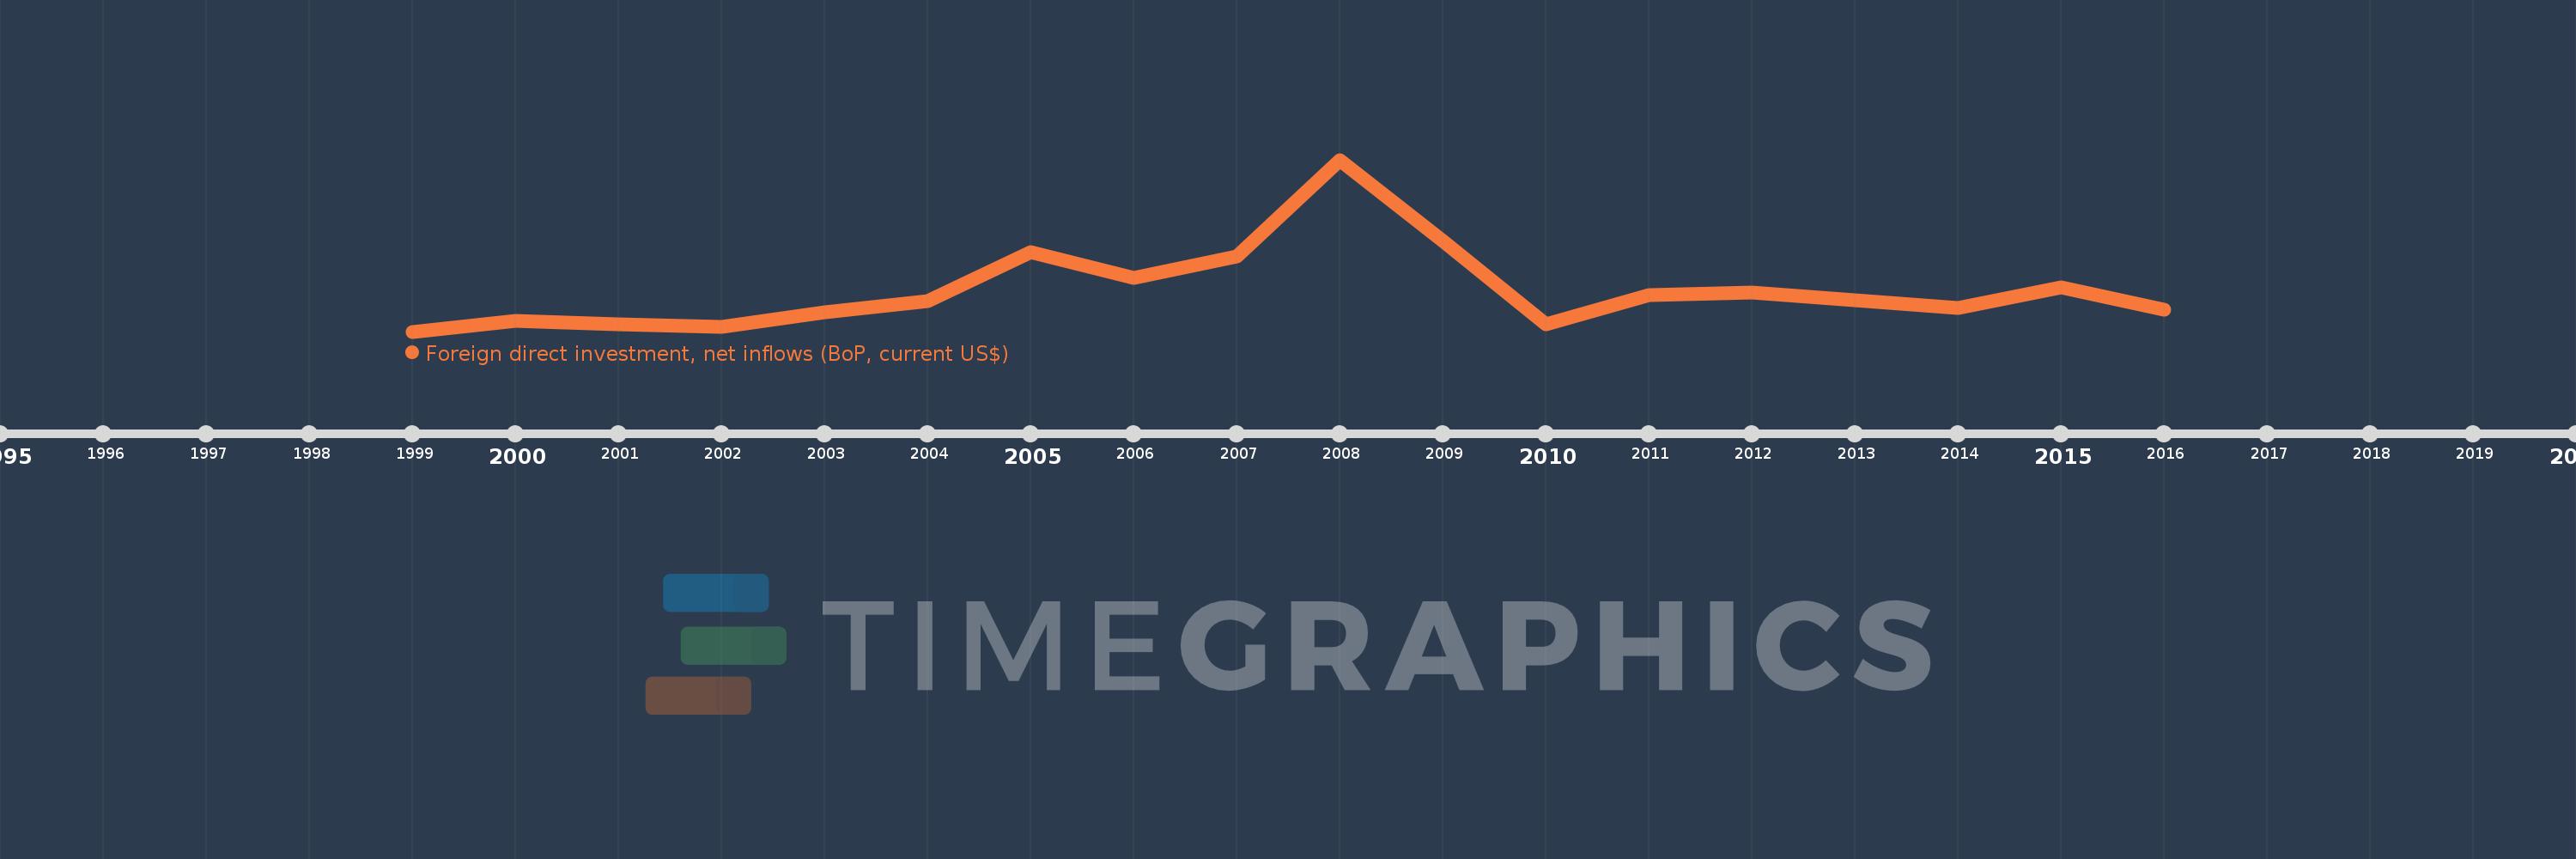
Cette échelle de temps montre un graphique de 1999 année à 2016 année Bosnia and Herzegovina. Les données jusqu'à 1998 année ne sont pas présentés. Quantité d'observations actuelles selon dates: 18.
Source (désignation):
Les indicateurs du développement mondiale
Source (organisation):
International Monetary Fund, Balance of Payments database, supplemented by data from the United Nations Conference on Trade and Development and official national sources.
Catégories:
Economy & Growth, Financial Sector, External Debt
Dernière mise à jour
23 avr. 2017
Les indicateurs de changement de valeurs selon les années
En moyenne:
496.641 mln.
Minimum:
66.736 mln.
1 janv. 1999
Maximum:
1.842 mds
1 janv. 2008
Pour la date d''observation
Valeur
Changement absolu
Le changement par rapport à la valeur précédente
1 janv. 1999
66.736 mln.
+66.736 mln.
0.0%
1 janv. 2000
176.781 mln.
+110.044 mln.
164.89%
1 janv. 2001
146.076 mln.
-30.705 mln.
-17.37%
1 janv. 2002
118.495 mln.
-27.58 mln.
-18.88%
1 janv. 2003
267.77 mln.
+149.274 mln.
125.97%
1 janv. 2004
381.785 mln.
+114.015 mln.
42.58%
1 janv. 2005
889.597 mln.
+507.813 mln.
133.01%
1 janv. 2006
623.813 mln.
-265.784 mln.
-29.88%
1 janv. 2007
845.963 mln.
+222.15 mln.
35.61%
1 janv. 2008
1.842 mds
+996.009 mln.
117.74%
1 janv. 2009
1.005 mds
-837.12 mln.
-45.45%
1 janv. 2010
138.511 mln.
-866.342 mln.
-86.22%
1 janv. 2011
443.84 mln.
+305.329 mln.
220.44%
1 janv. 2012
471.611 mln.
+27.771 mln.
6.26%
1 janv. 2013
391.977 mln.
-79.634 mln.
-16.89%
1 janv. 2014
313.295 mln.
-78.682 mln.
-20.07%
1 janv. 2015
523.014 mln.
+209.719 mln.
66.94%
1 janv. 2016
293.449 mln.
-229.565 mln.
-43.89%
Classement des pays selon les statistiques actuelles par années