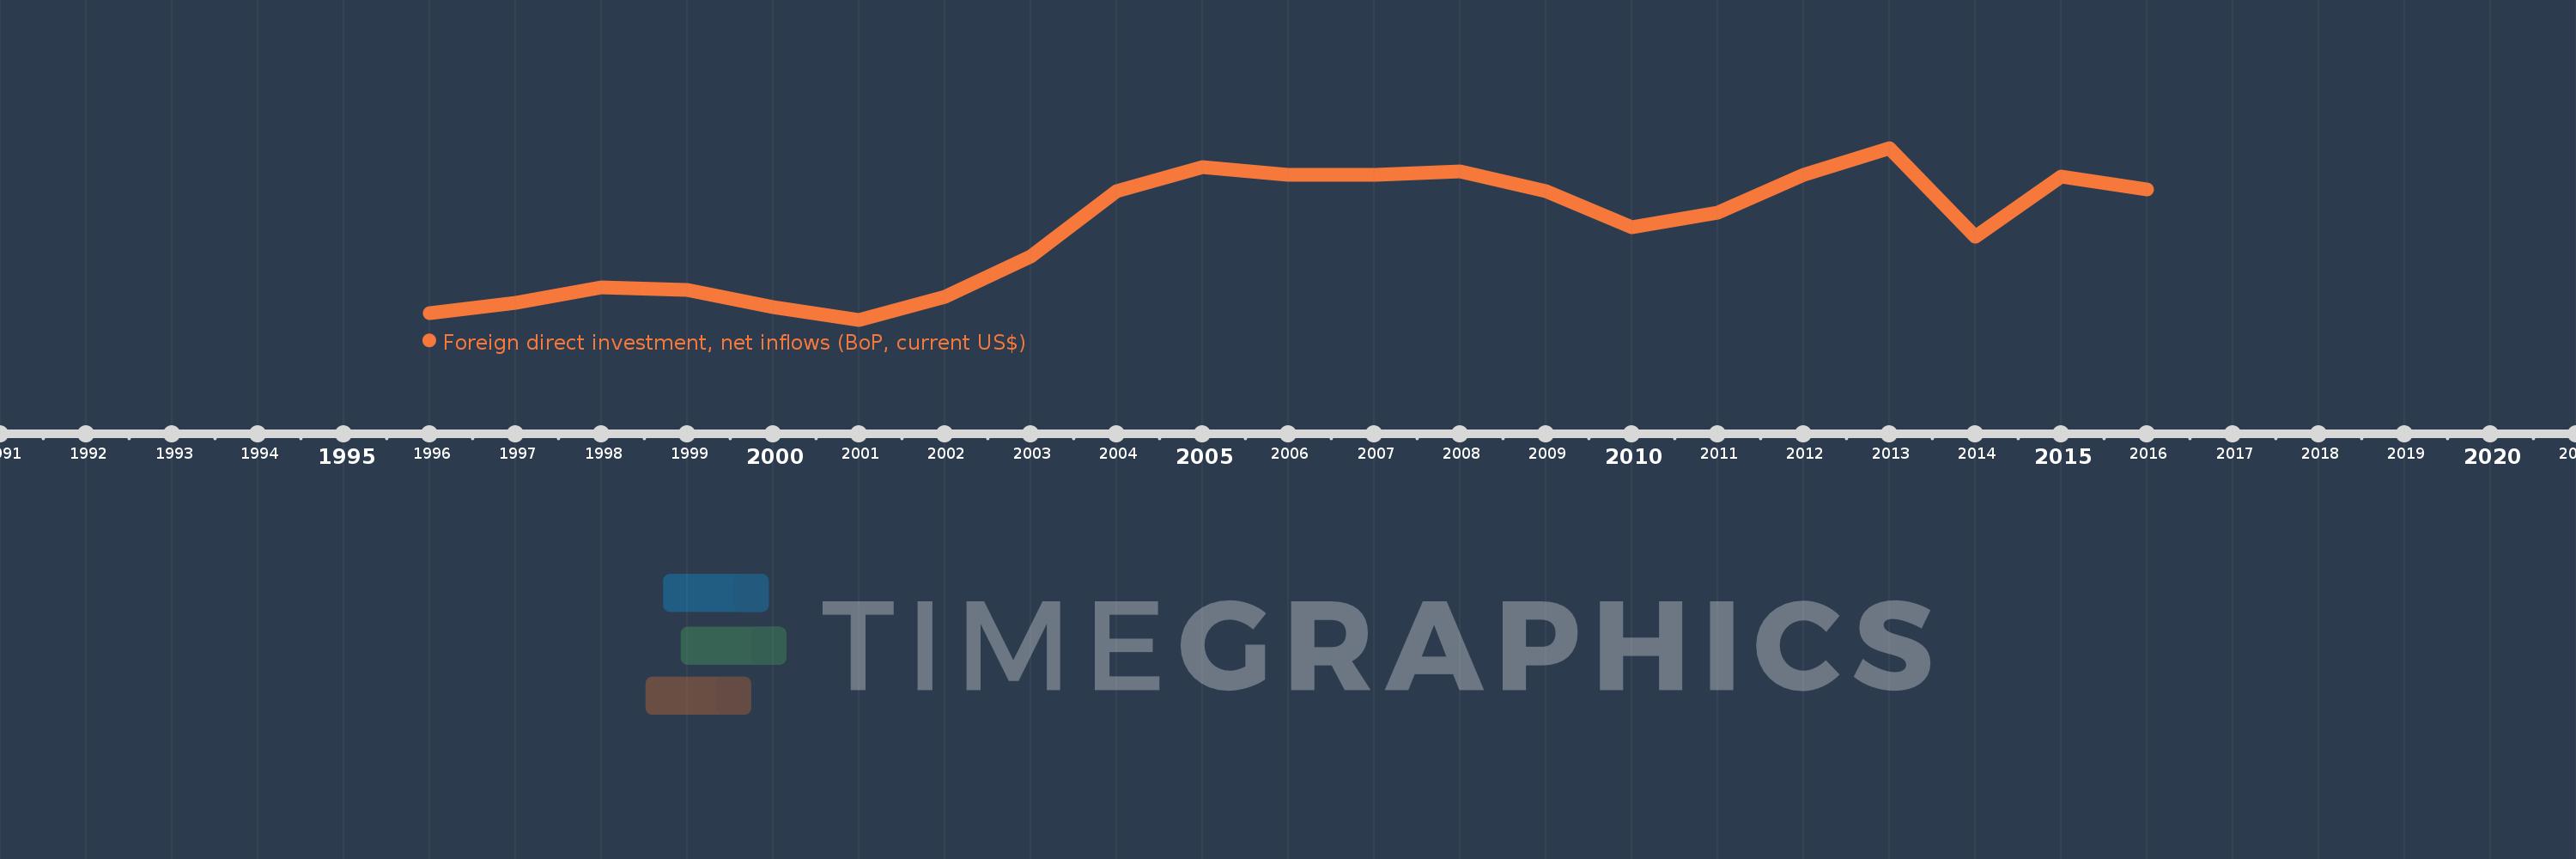
Cette échelle de temps montre un graphique de 1996 année à 2016 année Azerbaijan. Les données jusqu'à 1995 année ne sont pas présentés. Quantité d'observations actuelles selon dates: 21.
Source (désignation):
Les indicateurs du développement mondiale
Source (organisation):
International Monetary Fund, Balance of Payments database, supplemented by data from the United Nations Conference on Trade and Development and official national sources.
Catégories:
Economy & Growth, Financial Sector, External Debt
Dernière mise à jour
23 avr. 2017
Les indicateurs de changement de valeurs selon les années
En moyenne:
2.856 mds
Minimum:
129.937 mln.
1 janv. 2001
Maximum:
5.293 mds
1 janv. 2013
Pour la date d''observation
Valeur
Changement absolu
Le changement par rapport à la valeur précédente
1 janv. 1996
330.05 mln.
+330.05 mln.
0.0%
1 janv. 1997
627.277 mln.
+297.227 mln.
90.06%
1 janv. 1998
1.115 mds
+487.561 mln.
77.73%
1 janv. 1999
1.023 mds
-91.871 mln.
-8.24%
1 janv. 2000
510.317 mln.
-512.65 mln.
-50.11%
1 janv. 2001
129.937 mln.
-380.38 mln.
-74.54%
1 janv. 2002
819.579 mln.
+689.642 mln.
530.75%
1 janv. 2003
2.025 mds
+1.205 mds
147.03%
1 janv. 2004
4.007 mds
+1.983 mds
97.93%
1 janv. 2005
4.719 mds
+711.777 mln.
17.76%
1 janv. 2006
4.476 mds
-242.711 mln.
-5.14%
1 janv. 2007
4.486 mds
+9.57 mln.
0.21%
1 janv. 2008
4.594 mds
+108.268 mln.
2.41%
1 janv. 2009
3.987 mds
-607.427 mln.
-13.22%
1 janv. 2010
2.9 mds
-1.087 mds
-27.26%
1 janv. 2011
3.353 mds
+452.967 mln.
15.62%
1 janv. 2012
4.485 mds
+1.132 mds
33.76%
1 janv. 2013
5.293 mds
+808.13 mln.
18.02%
1 janv. 2014
2.619 mds
-2.674 mds
-50.51%
1 janv. 2015
4.43 mds
+1.811 mds
69.14%
1 janv. 2016
4.048 mds
-382.836 mln.
-8.64%
Classement des pays selon les statistiques actuelles par années