33
/fr/
AIzaSyAYiBZKx7MnpbEhh9jyipgxe19OcubqV5w
May 1, 2025
81017
Belarus
BLR
true
2
1
Personal remittances, paid (current US$)
2016,2015,2014,2013,2012,2011,2010,2009,2008,2007,2006,2005,2004,2003,2002,2001,2000,1999,1998,1997,1996,1995,1994
Download
Bibliothèque de statistiques globales →Belarus →

Personal remittances, paid (current US$)

Cette statistique dans les autres pays:

AfghanistanAlbaniaAlgeriaAngolaAntigua and BarbudaArab WorldArgentinaArmeniaArubaAustraliaAustriaAzerbaijanBahamas, TheBahrainBangladeshBarbadosBelarusBelgiumBelizeBeninBermudaBhutanBoliviaBosnia and HerzegovinaBotswanaBrazilBrunei DarussalamBulgariaBurkina FasoBurundiCabo VerdeCambodiaCameroonCanadaCaribbean small statesCentral African RepublicCentral Europe and the BalticsChadChileChinaColombiaComorosCongo, Dem. Rep.Congo, Rep.Costa RicaCote d'IvoireCroatiaCuracaoCyprusCzech RepublicDenmarkDjiboutiDominicaDominican RepublicEarly-demographic dividendEast Asia & PacificEast Asia & Pacific (excluding high income)East Asia & Pacific (IDA & IBRD countries)EcuadorEgypt, Arab Rep.El SalvadorEquatorial GuineaEritreaEstoniaEthiopiaEuro areaEurope & Central AsiaEurope & Central Asia (excluding high income)Europe & Central Asia (IDA & IBRD countries)European UnionFaroe IslandsFijiFinlandFragile and conflict affected situationsFranceFrench PolynesiaGabonGambia, TheGeorgiaGermanyGhanaGreeceGrenadaGuatemalaGuineaGuinea-BissauGuyanaHaitiHeavily indebted poor countries (HIPC)High incomeHondurasHong Kong SAR, ChinaHungaryIBRD onlyIcelandIDA & IBRD totalIDA blendIDA onlyIDA totalIndiaIndonesiaIraqIrelandIsraelItalyJamaicaJapanJordanKazakhstanKenyaKiribatiKorea, Rep.KosovoKuwaitKyrgyz RepublicLao PDRLate-demographic dividendLatin America & Caribbean Latin America & Caribbean (excluding high income)Latin America & the Caribbean (IDA & IBRD countries)LatviaLeast developed countries: UN classificationLebanonLesothoLiberiaLibyaLithuaniaLow & middle incomeLow incomeLower middle incomeLuxembourgMacao SAR, ChinaMacedonia, FYRMadagascarMalawiMalaysiaMaldivesMaliMaltaMarshall IslandsMauritaniaMauritiusMexicoMicronesia, Fed. Sts.Middle East & North AfricaMiddle East & North Africa (excluding high income)Middle East & North Africa (IDA & IBRD countries)Middle incomeMoldovaMongoliaMontenegroMoroccoMozambiqueMyanmarNamibiaNepalNetherlandsNew CaledoniaNew ZealandNicaraguaNigerNigeriaNorth AmericaNorwayOECD membersOmanOther small statesPacific island small statesPakistanPalauPanamaPapua New GuineaParaguayPeruPhilippinesPolandPortugalPost-demographic dividendPre-demographic dividendQatarRomaniaRussian FederationRwandaSamoaSao Tome and PrincipeSaudi ArabiaSenegalSerbiaSeychellesSierra LeoneSint Maarten (Dutch part)Slovak RepublicSloveniaSmall statesSolomon IslandsSomaliaSouth AfricaSouth AsiaSouth Asia (IDA & IBRD)South SudanSpainSri LankaSt. Kitts and NevisSt. LuciaSt. Vincent and the GrenadinesSub-Saharan Africa Sub-Saharan Africa (excluding high income)Sub-Saharan Africa (IDA & IBRD countries)SudanSurinameSwazilandSwedenSwitzerlandSyrian Arab RepublicTajikistanTanzaniaThailandTimor-LesteTogoTongaTrinidad and TobagoTunisiaTurkeyTurkmenistanTuvaluUgandaUkraineUnited KingdomUnited StatesUpper middle incomeUruguayVanuatuVenezuela, RBVietnamWest Bank and GazaWorldYemen, Rep.ZambiaZimbabwe

La ligne de temps

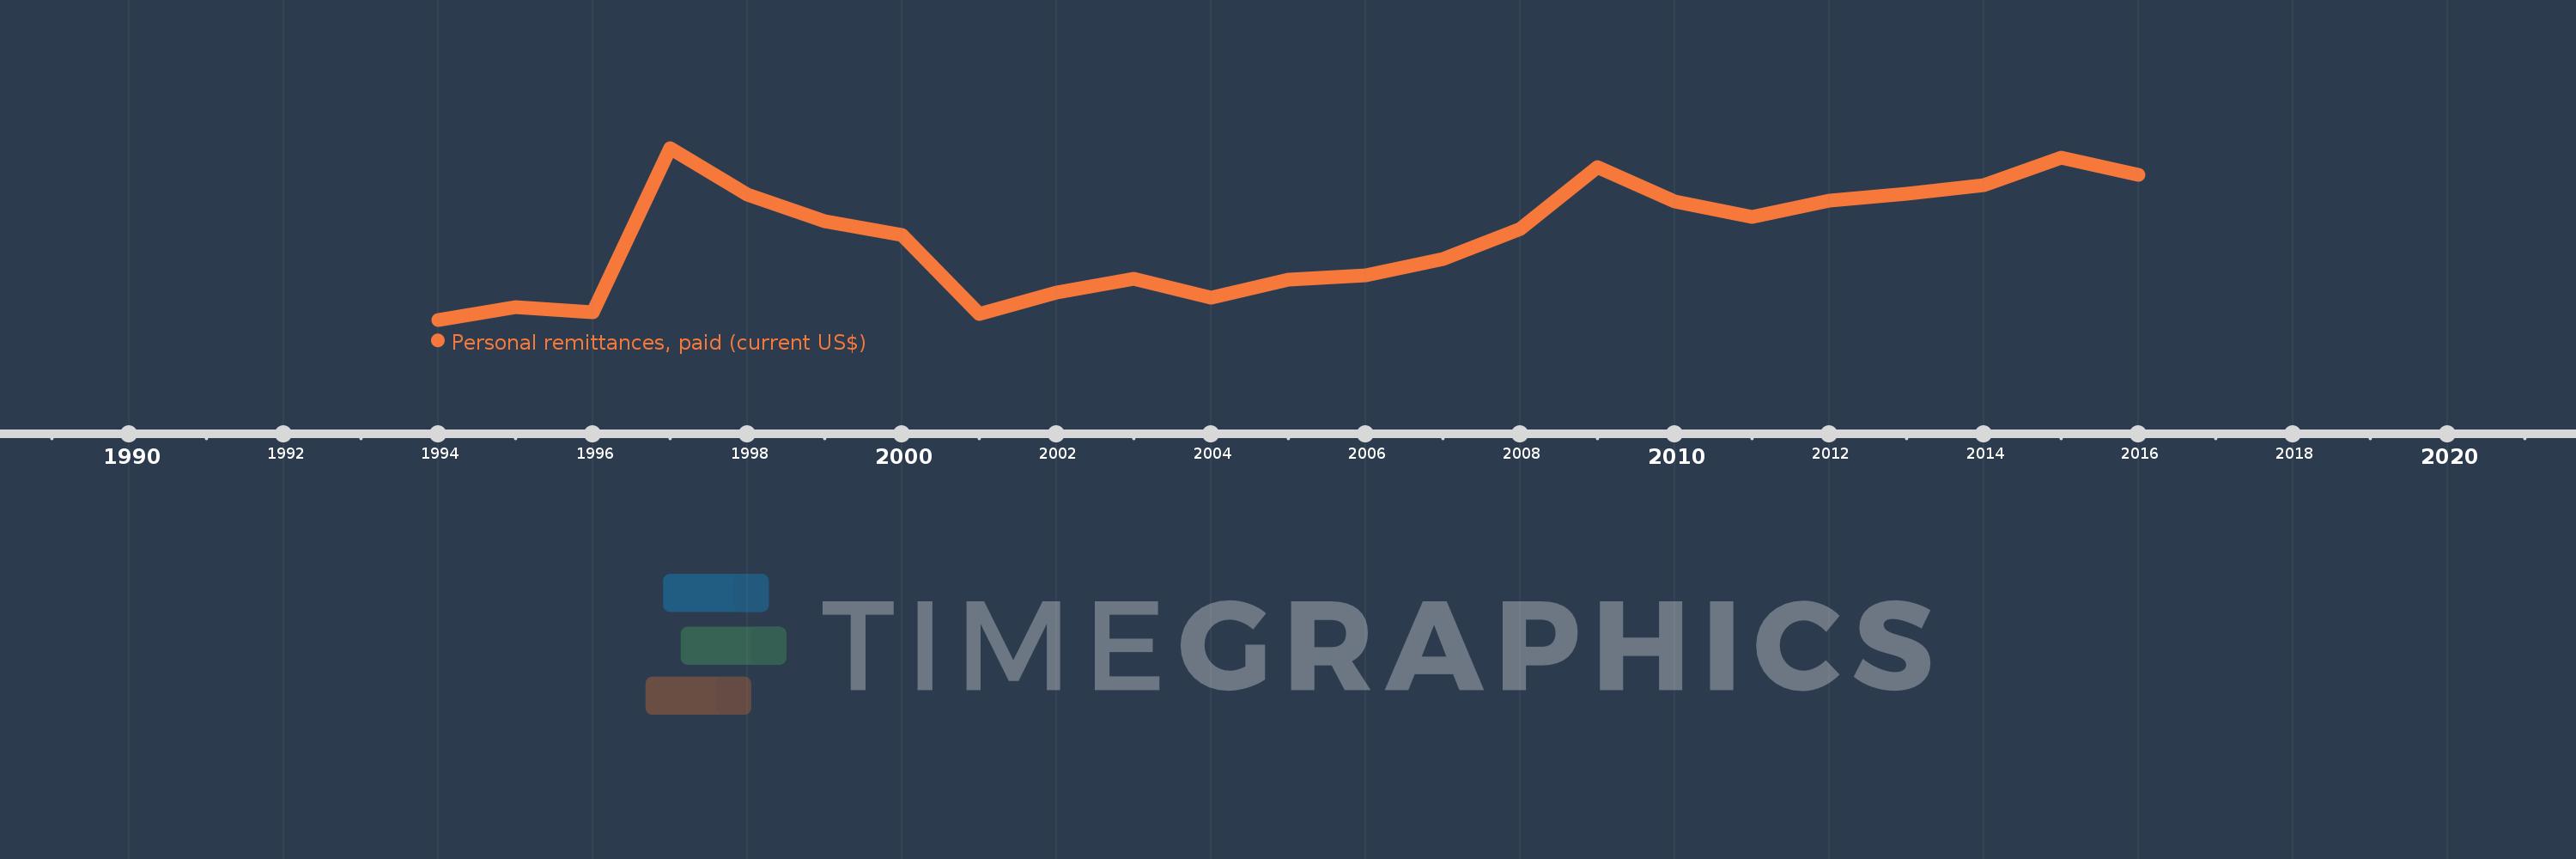
Cette échelle de temps montre un graphique de 1994 année à 2016 année Belarus. Les données jusqu'à 1993 année ne sont pas présentés. Quantité d'observations actuelles selon dates: 23.

Source (désignation):

Les indicateurs du développement mondiale

Source (organisation):

World Bank staff estimates based on IMF balance of payments data.

Catégories:

Economy & Growth, Financial Sector

Dernière mise à jour

23 avr. 2017

Les indicateurs de changement de valeurs selon les années

En moyenne:
93.678 mln.
Minimum:
3.5 mln.
1 janv. 1994
Maximum:
191.7 mln.
1 janv. 1997
Pour la date d''observation
Valeur
Changement absolu
Le changement par rapport à la valeur précédente
1 janv. 1994
3.5 mln.
+3.5 mln.
0.0%
1 janv. 1995
17.0 mln.
+13.5 mln.
385.71%
1 janv. 1996
11.9 mln.
-5.1 mln.
-30.0%
1 janv. 1997
191.7 mln.
+179.8 mln.
1.51 milles%
1 janv. 1998
140.5 mln.
-51.2 mln.
-26.71%
1 janv. 1999
111.1 mln.
-29.4 mln.
-20.93%
1 janv. 2000
96.7 mln.
-14.4 mln.
-12.96%
1 janv. 2001
9.6 mln.
-87.1 mln.
-90.07%
1 janv. 2002
33.2 mln.
+23.6 mln.
245.83%
1 janv. 2003
48.8 mln.
+15.6 mln.
46.99%
1 janv. 2004
28.1 mln.
-20.7 mln.
-42.42%
1 janv. 2005
47.1 mln.
+19.0 mln.
67.62%
1 janv. 2006
52.2 mln.
+5.1 mln.
10.83%
1 janv. 2007
70.4 mln.
+18.2 mln.
34.87%
1 janv. 2008
103.2 mln.
+32.8 mln.
46.59%
1 janv. 2009
171.0 mln.
+67.8 mln.
65.7%
1 janv. 2010
133.0 mln.
-38.0 mln.
-22.22%
1 janv. 2011
115.7 mln.
-17.3 mln.
-13.01%
1 janv. 2012
133.8 mln.
+18.1 mln.
15.64%
1 janv. 2013
141.7 mln.
+7.9 mln.
5.9%
1 janv. 2014
150.8 mln.
+9.1 mln.
6.42%
1 janv. 2015
181.2 mln.
+30.4 mln.
20.16%
1 janv. 2016
162.4 mln.
-18.8 mln.
-10.38%

Classement des pays selon les statistiques actuelles par années