33
/fr/
AIzaSyAYiBZKx7MnpbEhh9jyipgxe19OcubqV5w
August 1, 2025
261383
Tanzania
TZA
true
2
1
Personal remittances, paid (current US$)
2016,2015,2014,2013,2012,2011,2010,2009,2008,2007,2006,2005,2004,2003,2002,2001,2000,1999,1998,1997,1996,1979,1978,1977
Download
Bibliothèque de statistiques globales →Tanzania →

Personal remittances, paid (current US$)

Cette statistique dans les autres pays:

AfghanistanAlbaniaAlgeriaAngolaAntigua and BarbudaArab WorldArgentinaArmeniaArubaAustraliaAustriaAzerbaijanBahamas, TheBahrainBangladeshBarbadosBelarusBelgiumBelizeBeninBermudaBhutanBoliviaBosnia and HerzegovinaBotswanaBrazilBrunei DarussalamBulgariaBurkina FasoBurundiCabo VerdeCambodiaCameroonCanadaCaribbean small statesCentral African RepublicCentral Europe and the BalticsChadChileChinaColombiaComorosCongo, Dem. Rep.Congo, Rep.Costa RicaCote d'IvoireCroatiaCuracaoCyprusCzech RepublicDenmarkDjiboutiDominicaDominican RepublicEarly-demographic dividendEast Asia & PacificEast Asia & Pacific (excluding high income)East Asia & Pacific (IDA & IBRD countries)EcuadorEgypt, Arab Rep.El SalvadorEquatorial GuineaEritreaEstoniaEthiopiaEuro areaEurope & Central AsiaEurope & Central Asia (excluding high income)Europe & Central Asia (IDA & IBRD countries)European UnionFaroe IslandsFijiFinlandFragile and conflict affected situationsFranceFrench PolynesiaGabonGambia, TheGeorgiaGermanyGhanaGreeceGrenadaGuatemalaGuineaGuinea-BissauGuyanaHaitiHeavily indebted poor countries (HIPC)High incomeHondurasHong Kong SAR, ChinaHungaryIBRD onlyIcelandIDA & IBRD totalIDA blendIDA onlyIDA totalIndiaIndonesiaIraqIrelandIsraelItalyJamaicaJapanJordanKazakhstanKenyaKiribatiKorea, Rep.KosovoKuwaitKyrgyz RepublicLao PDRLate-demographic dividendLatin America & Caribbean Latin America & Caribbean (excluding high income)Latin America & the Caribbean (IDA & IBRD countries)LatviaLeast developed countries: UN classificationLebanonLesothoLiberiaLibyaLithuaniaLow & middle incomeLow incomeLower middle incomeLuxembourgMacao SAR, ChinaMacedonia, FYRMadagascarMalawiMalaysiaMaldivesMaliMaltaMarshall IslandsMauritaniaMauritiusMexicoMicronesia, Fed. Sts.Middle East & North AfricaMiddle East & North Africa (excluding high income)Middle East & North Africa (IDA & IBRD countries)Middle incomeMoldovaMongoliaMontenegroMoroccoMozambiqueMyanmarNamibiaNepalNetherlandsNew CaledoniaNew ZealandNicaraguaNigerNigeriaNorth AmericaNorwayOECD membersOmanOther small statesPacific island small statesPakistanPalauPanamaPapua New GuineaParaguayPeruPhilippinesPolandPortugalPost-demographic dividendPre-demographic dividendQatarRomaniaRussian FederationRwandaSamoaSao Tome and PrincipeSaudi ArabiaSenegalSerbiaSeychellesSierra LeoneSint Maarten (Dutch part)Slovak RepublicSloveniaSmall statesSolomon IslandsSomaliaSouth AfricaSouth AsiaSouth Asia (IDA & IBRD)South SudanSpainSri LankaSt. Kitts and NevisSt. LuciaSt. Vincent and the GrenadinesSub-Saharan Africa Sub-Saharan Africa (excluding high income)Sub-Saharan Africa (IDA & IBRD countries)SudanSurinameSwazilandSwedenSwitzerlandSyrian Arab RepublicTajikistanTanzaniaThailandTimor-LesteTogoTongaTrinidad and TobagoTunisiaTurkeyTurkmenistanTuvaluUgandaUkraineUnited KingdomUnited StatesUpper middle incomeUruguayVanuatuVenezuela, RBVietnamWest Bank and GazaWorldYemen, Rep.ZambiaZimbabwe

La ligne de temps

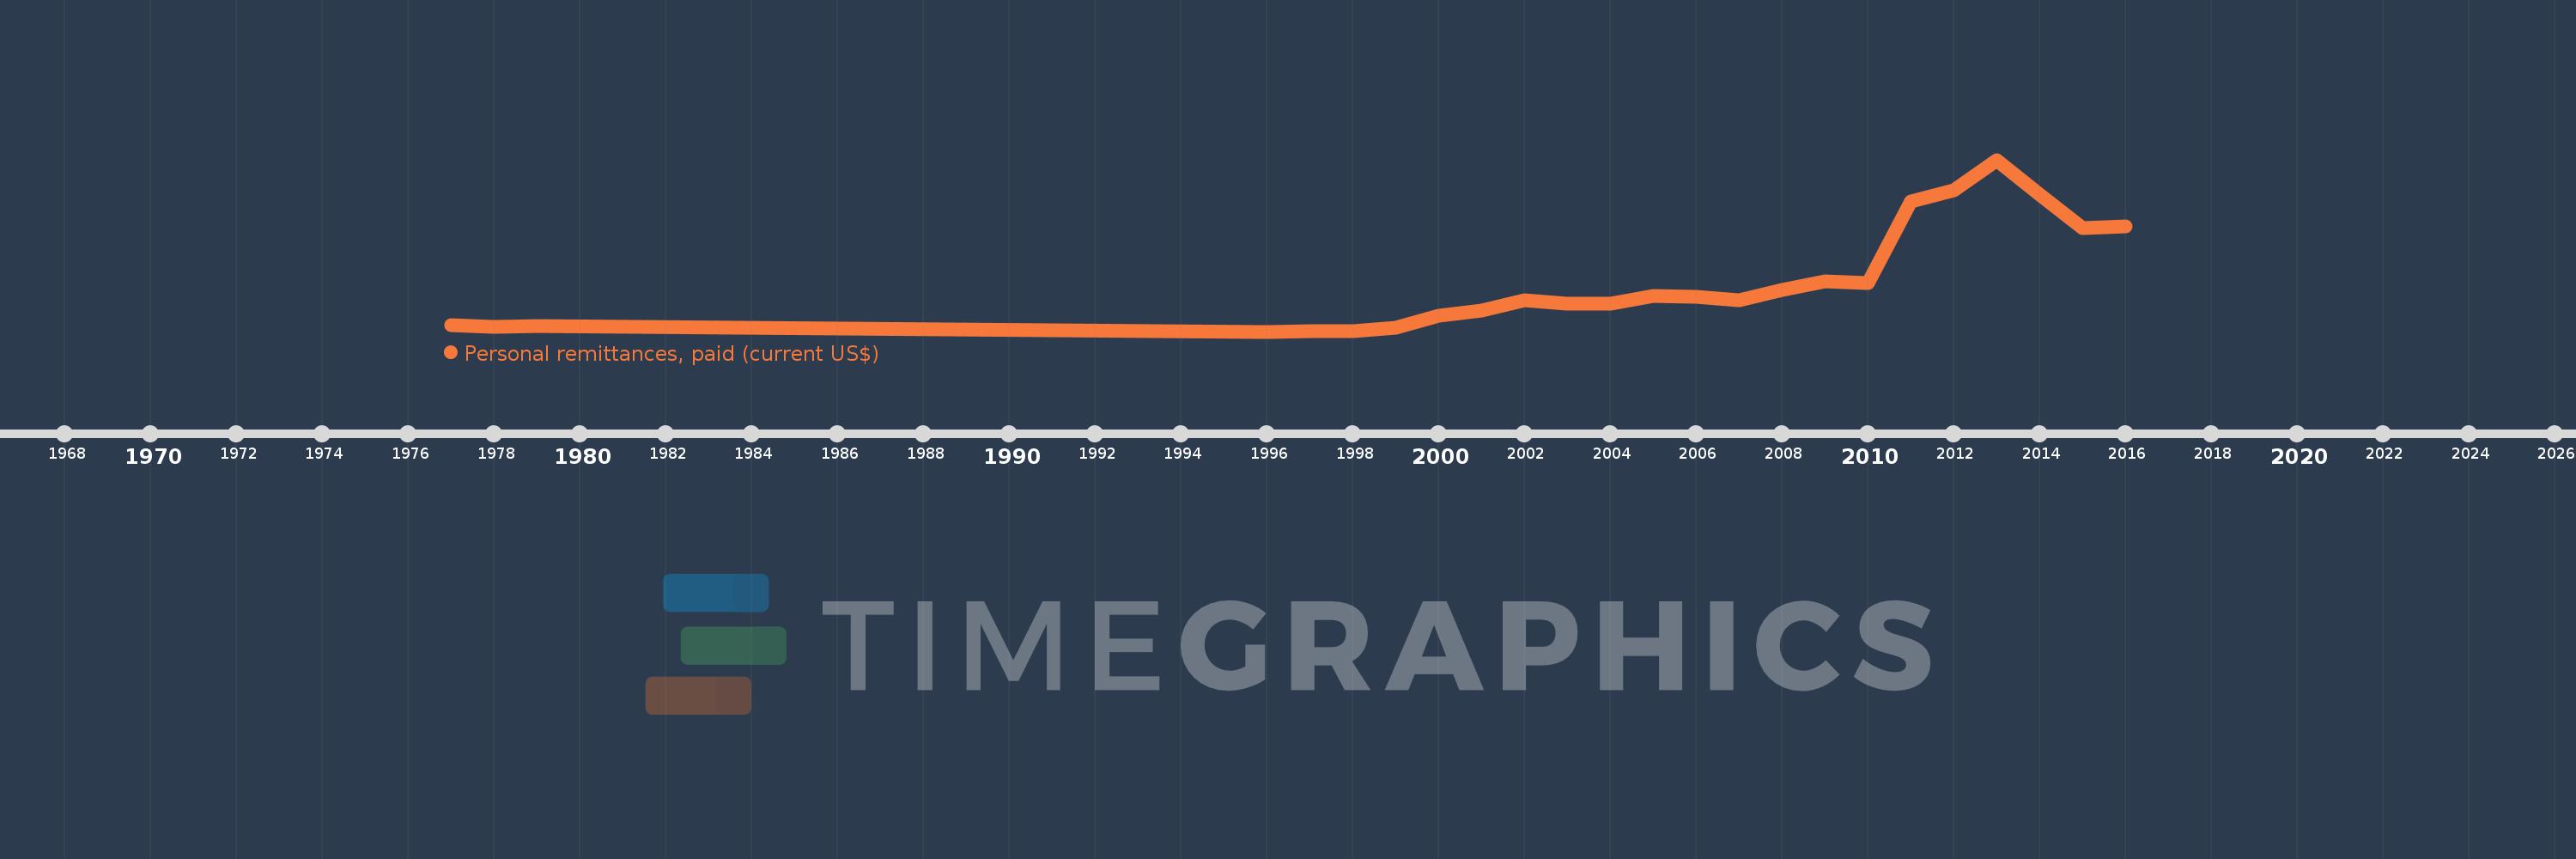
Cette échelle de temps montre un graphique de 1977 année à 2016 année Tanzania. Les données jusqu'à 1976 année ne sont pas présentés. Quantité d'observations actuelles selon dates: 24.

Source (désignation):

Les indicateurs du développement mondiale

Source (organisation):

World Bank staff estimates based on IMF balance of payments data.

Catégories:

Economy & Growth, Financial Sector

Dernière mise à jour

23 avr. 2017

Les indicateurs de changement de valeurs selon les années

En moyenne:
46.687 mln.
Minimum:
509.776 milles
1 janv. 1996
Maximum:
162.403 mln.
1 janv. 2013
Pour la date d''observation
Valeur
Changement absolu
Le changement par rapport à la valeur précédente
1 janv. 1977
6.805 mln.
+6.805 mln.
0.0%
1 janv. 1978
5.308 mln.
-1.496 mln.
-21.99%
1 janv. 1979
6.094 mln.
+786.252 milles
14.81%
1 janv. 1996
509.776 milles
-5.585 mln.
-91.64%
1 janv. 1997
810.377 milles
+300.601 milles
58.97%
1 janv. 1998
645.296 milles
-165.082 milles
-20.37%
1 janv. 1999
4.017 mln.
+3.372 mln.
522.51%
1 janv. 2000
15.4 mln.
+11.383 mln.
283.37%
1 janv. 2001
20.3 mln.
+4.9 mln.
31.82%
1 janv. 2002
29.675 mln.
+9.375 mln.
46.18%
1 janv. 2003
26.992 mln.
-2.683 mln.
-9.04%
1 janv. 2004
27.102 mln.
+109.862 milles
0.41%
1 janv. 2005
33.886 mln.
+6.785 mln.
25.04%
1 janv. 2006
33.224 mln.
-662.506 milles
-1.96%
1 janv. 2007
29.655 mln.
-3.569 mln.
-10.74%
1 janv. 2008
39.372 mln.
+9.717 mln.
32.77%
1 janv. 2009
47.748 mln.
+8.376 mln.
21.27%
1 janv. 2010
46.612 mln.
-1.136 mln.
-2.38%
1 janv. 2011
123.024 mln.
+76.412 mln.
163.93%
1 janv. 2012
133.4 mln.
+10.376 mln.
8.43%
1 janv. 2013
162.403 mln.
+29.003 mln.
21.74%
1 janv. 2014
129.704 mln.
-32.699 mln.
-20.13%
1 janv. 2015
98.283 mln.
-31.421 mln.
-24.23%
1 janv. 2016
99.518 mln.
+1.235 mln.
1.26%

Classement des pays selon les statistiques actuelles par années