29
/fr/
fr
AIzaSyAYiBZKx7MnpbEhh9jyipgxe19OcubqV5w
April 1, 2024
78911
Bangladesh
BGD
true
2
1
Revenue, excluding grants (% of GDP)
2014,2013,2012,2011,2010,2009,2008,2007,2006,2005,2004,2003,2002
Download
Bibliothèque de statistiques globales →Bangladesh →

Revenue, excluding grants (% of GDP)

Cette statistique dans les autres pays:
AfghanistanAlbaniaAlgeriaAngolaAntigua and BarbudaArgentinaArmeniaAustraliaAustriaAzerbaijanBahamas, TheBahrainBangladeshBarbadosBelarusBelgiumBelizeBeninBhutanBoliviaBosnia and HerzegovinaBotswanaBrazilBulgariaBurkina FasoBurundiCabo VerdeCambodiaCanadaCaribbean small statesCentral African RepublicCentral Europe and the BalticsChileChinaColombiaCongo, Dem. Rep.Congo, Rep.Costa RicaCote d'IvoireCroatiaCyprusCzech RepublicDenmarkDominicaDominican RepublicEarly-demographic dividendEast Asia & PacificEast Asia & Pacific (excluding high income)East Asia & Pacific (IDA & IBRD countries)Egypt, Arab Rep.El SalvadorEquatorial GuineaEstoniaEthiopiaEuro areaEurope & Central AsiaEurope & Central Asia (excluding high income)Europe & Central Asia (IDA & IBRD countries)European UnionFijiFinlandFranceGambia, TheGeorgiaGermanyGhanaGreeceGrenadaGuatemalaHeavily indebted poor countries (HIPC)High incomeHondurasHong Kong SAR, ChinaHungaryIBRD onlyIcelandIDA & IBRD totalIDA blendIDA onlyIDA totalIndiaIndonesiaIran, Islamic Rep.IraqIrelandIsraelItalyJamaicaJapanJordanKazakhstanKenyaKiribatiKorea, Rep.KuwaitKyrgyz RepublicLao PDRLate-demographic dividendLatin America & Caribbean Latin America & Caribbean (excluding high income)Latin America & the Caribbean (IDA & IBRD countries)LatviaLeast developed countries: UN classificationLebanonLesothoLiberiaLithuaniaLow & middle incomeLow incomeLower middle incomeLuxembourgMacao SAR, ChinaMacedonia, FYRMadagascarMalawiMalaysiaMaldivesMaliMaltaMauritiusMexicoMicronesia, Fed. Sts.Middle East & North Africa (excluding high income)Middle East & North Africa (IDA & IBRD countries)Middle incomeMoldovaMongoliaMoroccoMozambiqueMyanmarNamibiaNepalNetherlandsNew ZealandNicaraguaNigeriaNorth AmericaNorwayOECD membersOmanOther small statesPacific island small statesPakistanPanamaPapua New GuineaParaguayPeruPhilippinesPolandPortugalPost-demographic dividendPre-demographic dividendQatarRomaniaRussian FederationRwandaSamoaSan MarinoSao Tome and PrincipeSenegalSerbiaSeychellesSierra LeoneSingaporeSlovak RepublicSloveniaSmall statesSolomon IslandsSouth AfricaSouth AsiaSouth Asia (IDA & IBRD)SpainSri LankaSt. Kitts and NevisSt. LuciaSt. Vincent and the GrenadinesSub-Saharan Africa Sub-Saharan Africa (excluding high income)Sub-Saharan Africa (IDA & IBRD countries)SurinameSwazilandSwedenSwitzerlandSyrian Arab RepublicTajikistanTanzaniaThailandTimor-LesteTogoTrinidad and TobagoTunisiaTurkeyUgandaUkraineUnited Arab EmiratesUnited KingdomUnited StatesUpper middle incomeUruguayVanuatuVenezuela, RBVietnamWest Bank and GazaWorldYemen, Rep.ZambiaZimbabwe
La ligne de temps
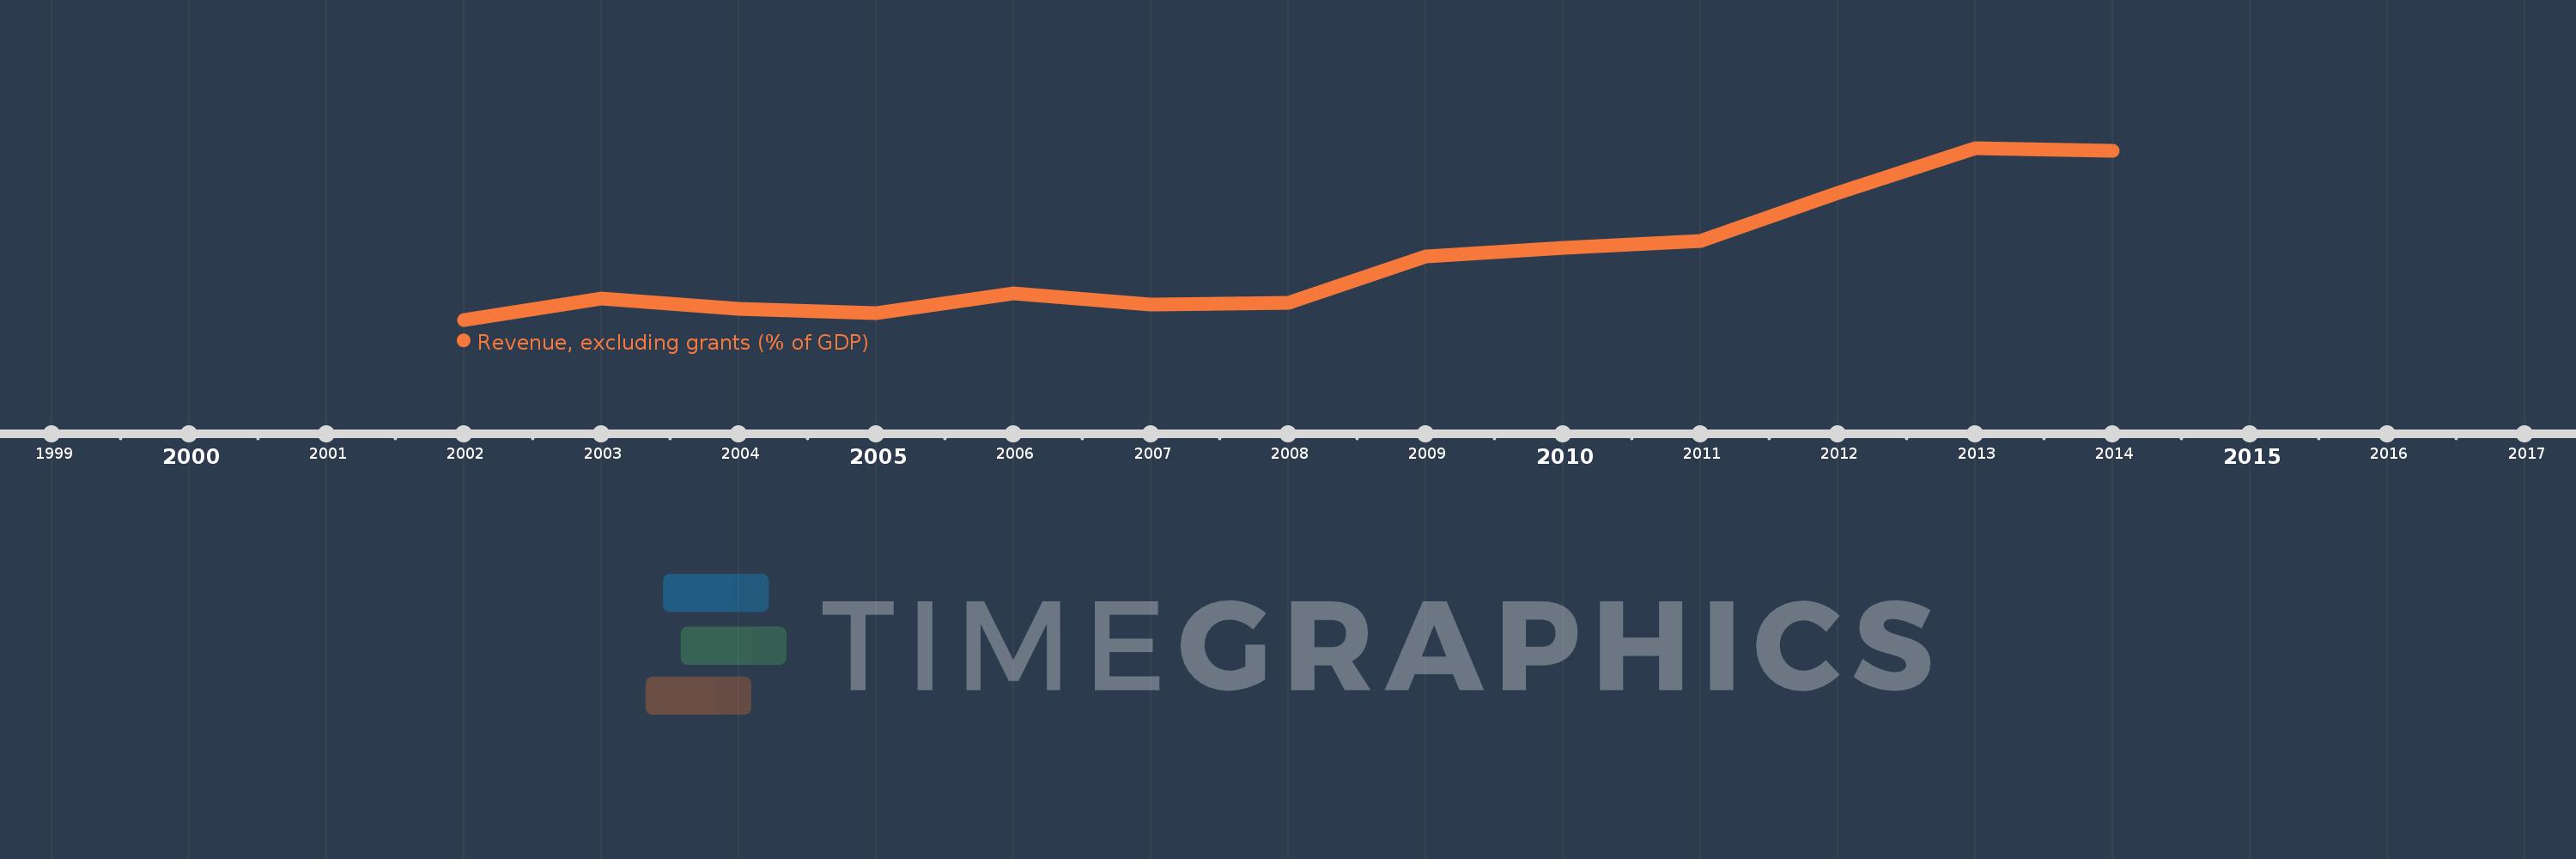
Cette échelle de temps montre un graphique de 2002 année à 2014 année Bangladesh. Les données jusqu'à 2001 année ne sont pas présentés. Quantité d'observations actuelles selon dates: 13.
Source (désignation):
Les indicateurs du développement mondiale
Source (organisation):
International Monetary Fund, Government Finance Statistics Yearbook and data files, and World Bank and OECD GDP estimates.
Catégories:
Economy & Growth, Public Sector
Dernière mise à jour
23 avr. 2017
Les indicateurs de changement de valeurs selon les années
En moyenne:
9.458
Minimum:
8.555
1 janv. 2002
Maximum:
11.145
1 janv. 2013
Pour la date d''observation
Valeur
Changement absolu
Le changement par rapport à la valeur précédente
1 janv. 2002
8.555
+8.555
0.0%
1 janv. 2003
8.875
+0.32
3.74%
1 janv. 2004
8.716
-0.159
-1.79%
1 janv. 2005
8.657
-0.059
-0.68%
1 janv. 2006
8.949
+0.292
3.38%
1 janv. 2007
8.778
-0.171
-1.91%
1 janv. 2008
8.811
+0.032
0.37%
1 janv. 2009
9.513
+0.702
7.97%
1 janv. 2010
9.643
+0.13
1.37%
1 janv. 2011
9.744
+0.101
1.04%
1 janv. 2012
10.463
+0.719
7.38%
1 janv. 2013
11.145
+0.683
6.52%
1 janv. 2014
11.1
-0.045
-0.4%
Classement des pays selon les statistiques actuelles par années

Commentaires:

Envoyer
PremiumAbout & FeedbackUn accordConfidentialité
logo
© 2022 Selected Technologies LLC – Morgan Hill, California