29
/fr/
fr
AIzaSyAYiBZKx7MnpbEhh9jyipgxe19OcubqV5w
April 1, 2024
172173
Kuwait
KWT
true
2
1
Revenue, excluding grants (% of GDP)
1999,1998,1997,1996,1995,1994,1993,1992,1991,1987,1986,1985,1984,1983,1982,1981,1980,1979,1978,1975,1974,1973
Download
Bibliothèque de statistiques globales →Kuwait →

Revenue, excluding grants (% of GDP)

Cette statistique dans les autres pays:
AfghanistanAlbaniaAlgeriaAngolaAntigua and BarbudaArgentinaArmeniaAustraliaAustriaAzerbaijanBahamas, TheBahrainBangladeshBarbadosBelarusBelgiumBelizeBeninBhutanBoliviaBosnia and HerzegovinaBotswanaBrazilBulgariaBurkina FasoBurundiCabo VerdeCambodiaCanadaCaribbean small statesCentral African RepublicCentral Europe and the BalticsChileChinaColombiaCongo, Dem. Rep.Congo, Rep.Costa RicaCote d'IvoireCroatiaCyprusCzech RepublicDenmarkDominicaDominican RepublicEarly-demographic dividendEast Asia & PacificEast Asia & Pacific (excluding high income)East Asia & Pacific (IDA & IBRD countries)Egypt, Arab Rep.El SalvadorEquatorial GuineaEstoniaEthiopiaEuro areaEurope & Central AsiaEurope & Central Asia (excluding high income)Europe & Central Asia (IDA & IBRD countries)European UnionFijiFinlandFranceGambia, TheGeorgiaGermanyGhanaGreeceGrenadaGuatemalaHeavily indebted poor countries (HIPC)High incomeHondurasHong Kong SAR, ChinaHungaryIBRD onlyIcelandIDA & IBRD totalIDA blendIDA onlyIDA totalIndiaIndonesiaIran, Islamic Rep.IraqIrelandIsraelItalyJamaicaJapanJordanKazakhstanKenyaKiribatiKorea, Rep.KuwaitKyrgyz RepublicLao PDRLate-demographic dividendLatin America & Caribbean Latin America & Caribbean (excluding high income)Latin America & the Caribbean (IDA & IBRD countries)LatviaLeast developed countries: UN classificationLebanonLesothoLiberiaLithuaniaLow & middle incomeLow incomeLower middle incomeLuxembourgMacao SAR, ChinaMacedonia, FYRMadagascarMalawiMalaysiaMaldivesMaliMaltaMauritiusMexicoMicronesia, Fed. Sts.Middle East & North Africa (excluding high income)Middle East & North Africa (IDA & IBRD countries)Middle incomeMoldovaMongoliaMoroccoMozambiqueMyanmarNamibiaNepalNetherlandsNew ZealandNicaraguaNigeriaNorth AmericaNorwayOECD membersOmanOther small statesPacific island small statesPakistanPanamaPapua New GuineaParaguayPeruPhilippinesPolandPortugalPost-demographic dividendPre-demographic dividendQatarRomaniaRussian FederationRwandaSamoaSan MarinoSao Tome and PrincipeSenegalSerbiaSeychellesSierra LeoneSingaporeSlovak RepublicSloveniaSmall statesSolomon IslandsSouth AfricaSouth AsiaSouth Asia (IDA & IBRD)SpainSri LankaSt. Kitts and NevisSt. LuciaSt. Vincent and the GrenadinesSub-Saharan Africa Sub-Saharan Africa (excluding high income)Sub-Saharan Africa (IDA & IBRD countries)SurinameSwazilandSwedenSwitzerlandSyrian Arab RepublicTajikistanTanzaniaThailandTimor-LesteTogoTrinidad and TobagoTunisiaTurkeyUgandaUkraineUnited Arab EmiratesUnited KingdomUnited StatesUpper middle incomeUruguayVanuatuVenezuela, RBVietnamWest Bank and GazaWorldYemen, Rep.ZambiaZimbabwe
La ligne de temps
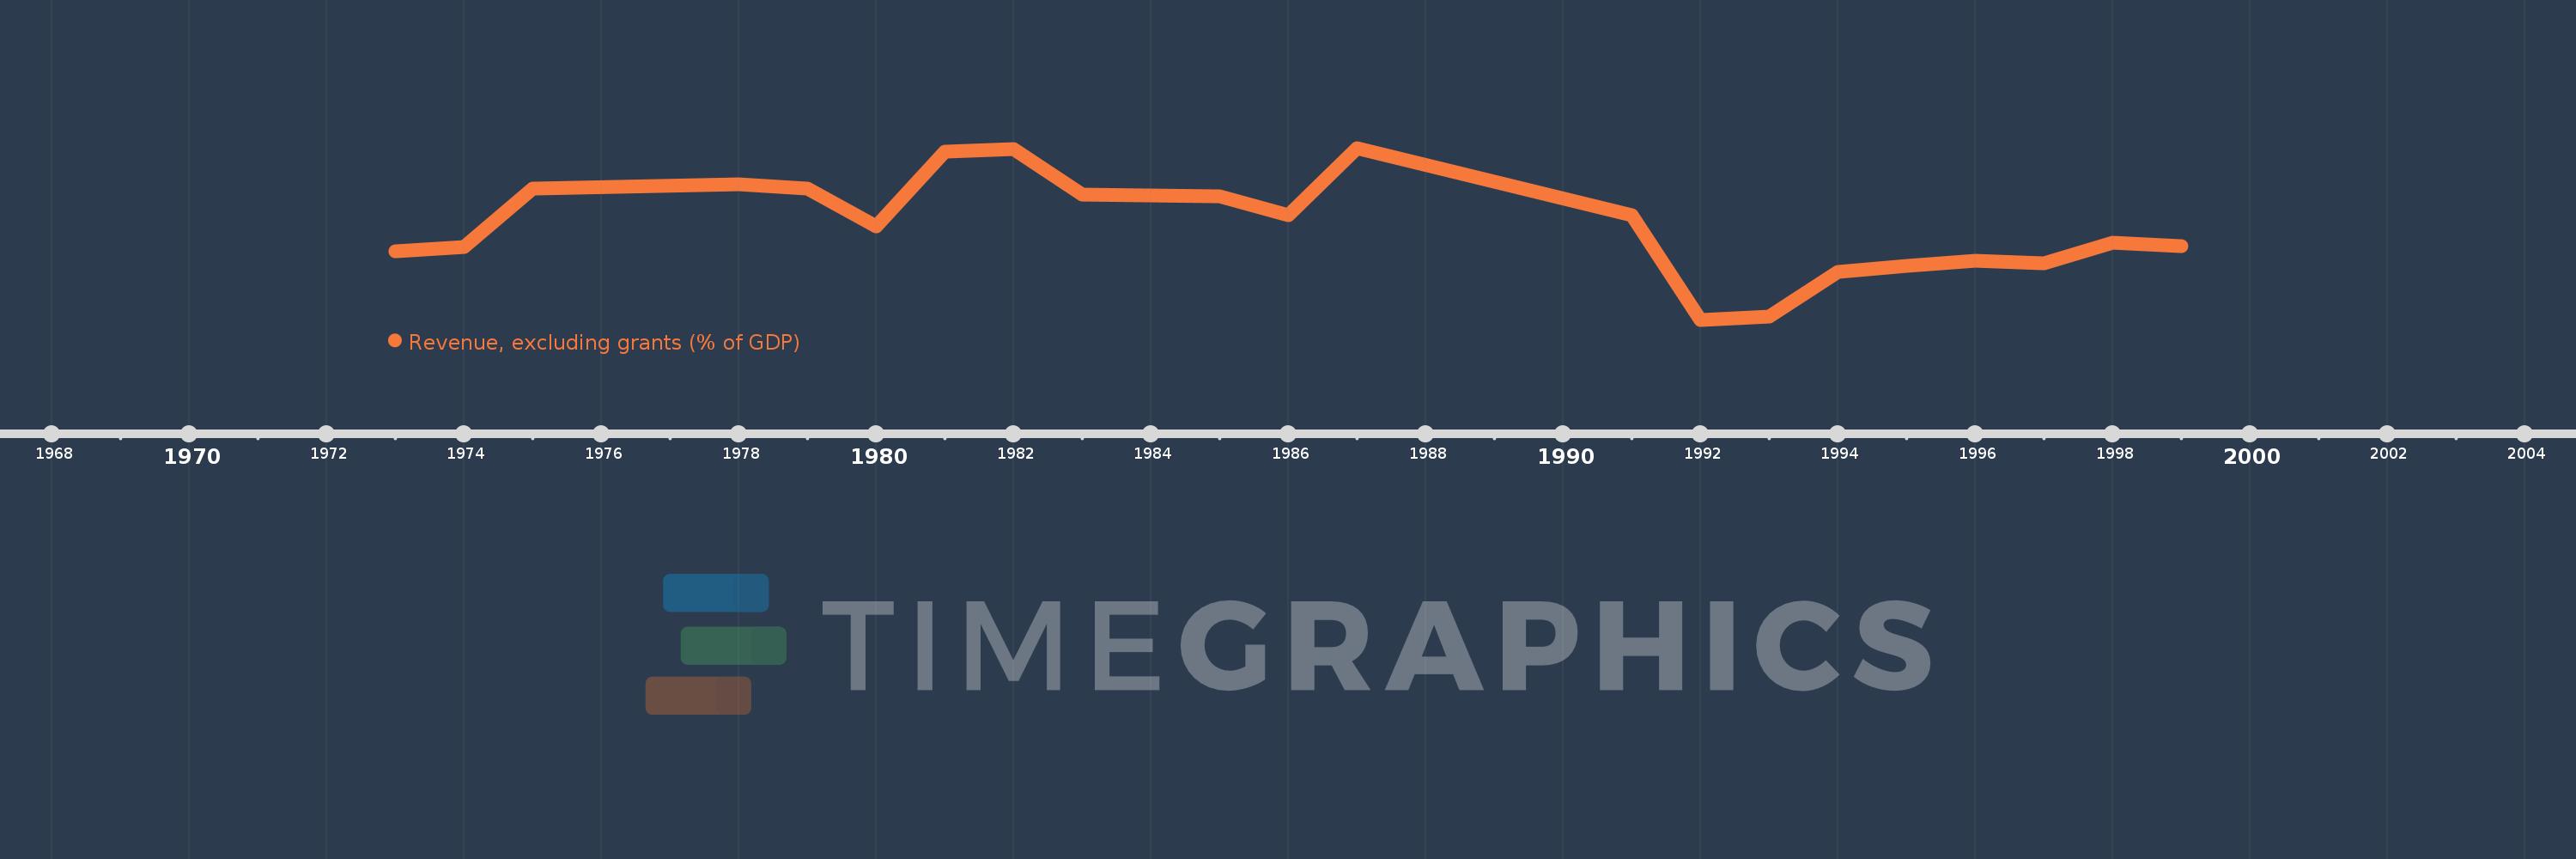
Cette échelle de temps montre un graphique de 1973 année à 1999 année Kuwait. Les données jusqu'à 1972 année ne sont pas présentés. Quantité d'observations actuelles selon dates: 22.
Source (désignation):
Les indicateurs du développement mondiale
Source (organisation):
International Monetary Fund, Government Finance Statistics Yearbook and data files, and World Bank and OECD GDP estimates.
Catégories:
Economy & Growth, Public Sector
Dernière mise à jour
23 avr. 2017
Les indicateurs de changement de valeurs selon les années
En moyenne:
54.267
Minimum:
8.371
1 janv. 1992
Maximum:
91.181
1 janv. 1987
Pour la date d''observation
Valeur
Changement absolu
Le changement par rapport à la valeur précédente
1 janv. 1973
41.53
+41.53
0.0%
1 janv. 1974
43.264
+1.734
4.18%
1 janv. 1975
71.44
+28.176
65.12%
1 janv. 1978
73.779
+2.339
3.27%
1 janv. 1979
71.407
-2.372
-3.22%
1 janv. 1980
53.262
-18.145
-25.41%
1 janv. 1981
89.342
+36.081
67.74%
1 janv. 1982
90.727
+1.384
1.55%
1 janv. 1983
68.767
-21.96
-24.2%
1 janv. 1984
68.136
-0.631
-0.92%
1 janv. 1985
67.833
-0.302
-0.44%
1 janv. 1986
58.822
-9.011
-13.28%
1 janv. 1987
91.181
+32.359
55.01%
1 janv. 1991
58.713
-32.469
-35.61%
1 janv. 1992
8.371
-50.342
-85.74%
1 janv. 1993
10.04
+1.669
19.94%
1 janv. 1994
31.354
+21.314
212.28%
1 janv. 1995
34.485
+3.131
9.99%
1 janv. 1996
36.801
+2.315
6.71%
1 janv. 1997
35.368
-1.432
-3.89%
1 janv. 1998
45.5
+10.132
28.65%
1 janv. 1999
43.758
-1.742
-3.83%
Classement des pays selon les statistiques actuelles par années

Commentaires:

Envoyer
PremiumAbout & FeedbackUn accordConfidentialité
logo
© 2022 Selected Technologies LLC – Morgan Hill, California