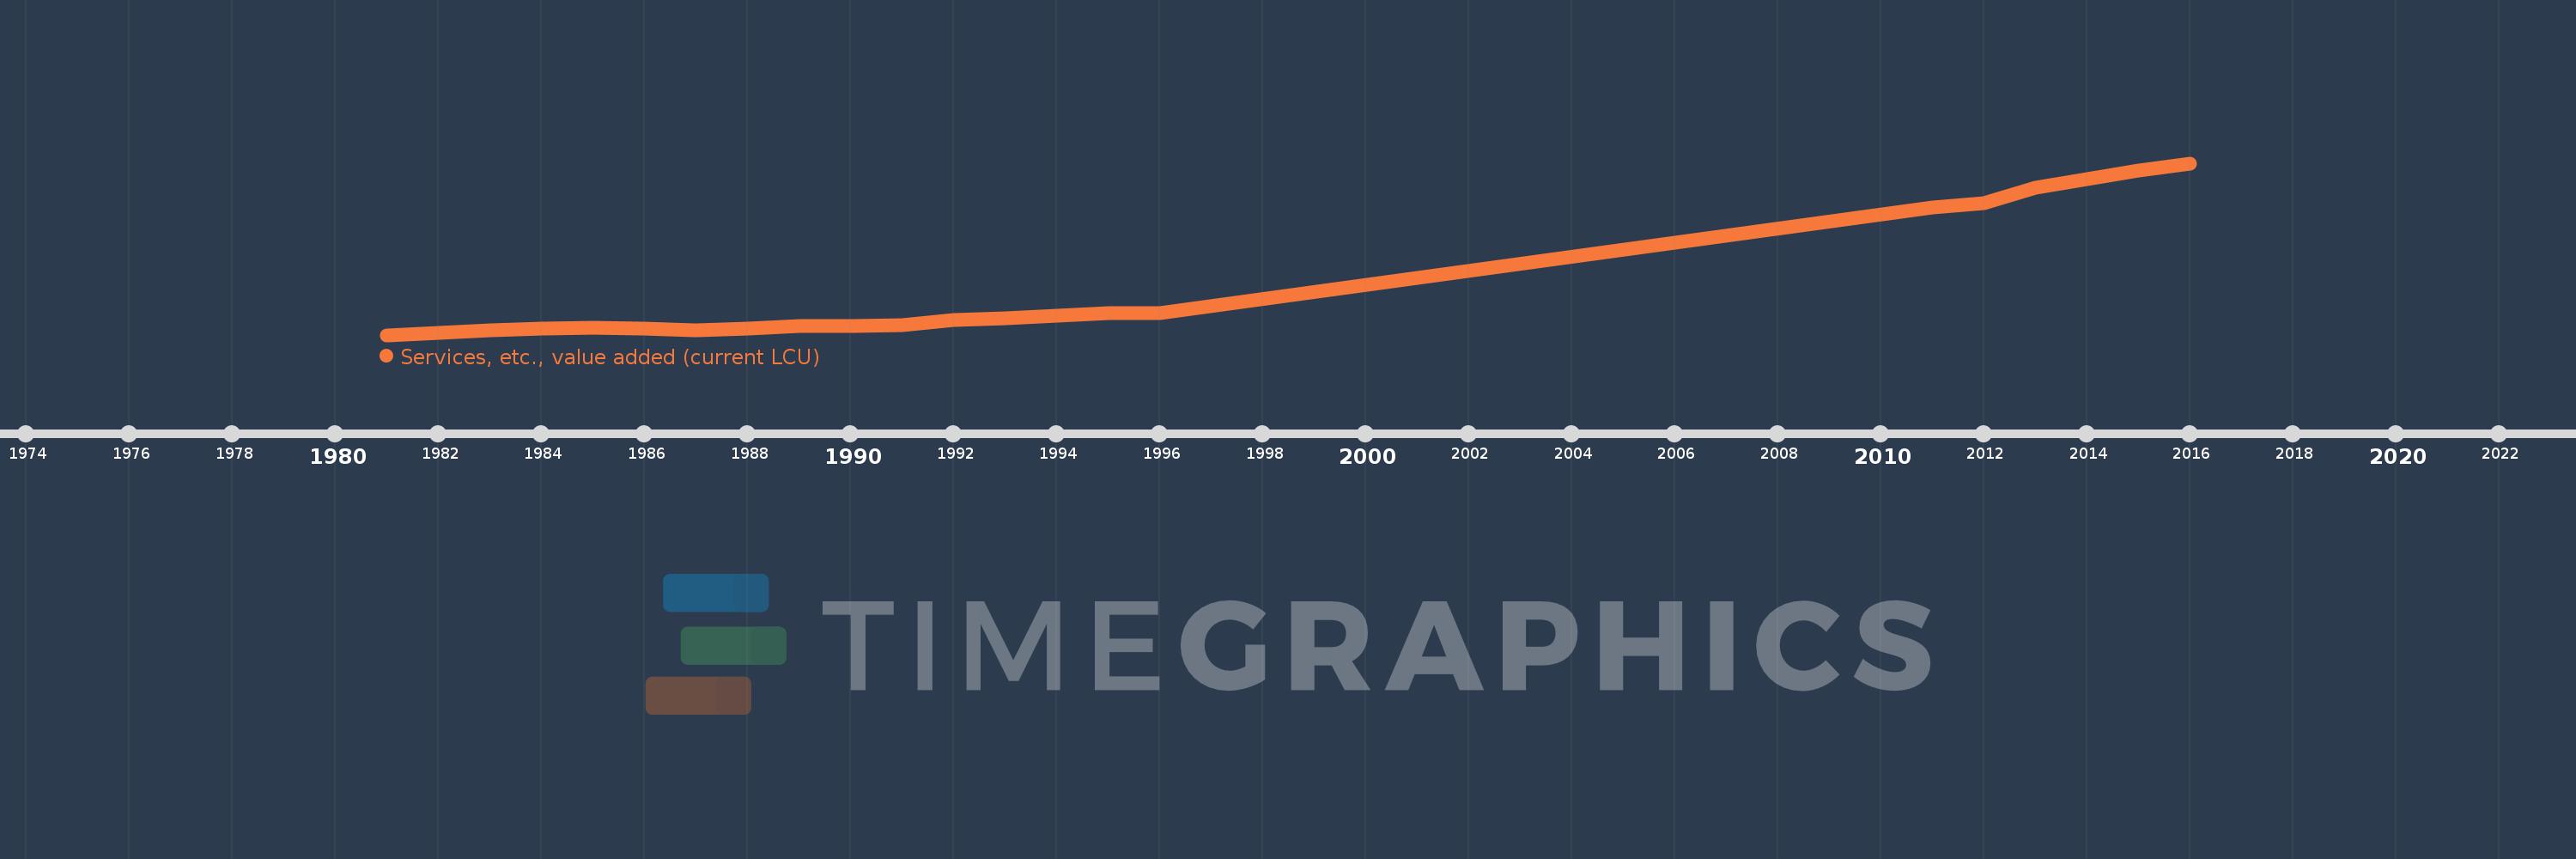
Cette échelle de temps montre un graphique de 1981 année à 2016 année Bahrain. Les données jusqu'à 1980 année ne sont pas présentés. Quantité d'observations actuelles selon dates: 22.
Source (désignation):
Les indicateurs du développement mondiale
Source (organisation):
World Bank national accounts data, and OECD National Accounts data files.
Catégories:
Economy & Growth
Dernière mise à jour
23 avr. 2017
Les indicateurs de changement de valeurs selon les années
En moyenne:
2.281 mds
Minimum:
462.4 mln.
1 janv. 1981
Maximum:
6.95 mds
1 janv. 2016
Pour la date d''observation
Valeur
Changement absolu
Le changement par rapport à la valeur précédente
1 janv. 1981
462.4 mln.
+462.4 mln.
0.0%
1 janv. 1982
537.0 mln.
+74.6 mln.
16.13%
1 janv. 1983
631.4 mln.
+94.4 mln.
17.58%
1 janv. 1984
711.4 mln.
+80.0 mln.
12.67%
1 janv. 1985
732.4 mln.
+21.0 mln.
2.95%
1 janv. 1986
691.4 mln.
-41.0 mln.
-5.6%
1 janv. 1987
632.471 mln.
-58.929 mln.
-8.52%
1 janv. 1988
696.772 mln.
+64.302 mln.
10.17%
1 janv. 1989
790.729 mln.
+93.957 mln.
13.48%
1 janv. 1990
818.977 mln.
+28.248 mln.
3.57%
1 janv. 1991
847.939 mln.
+28.962 mln.
3.54%
1 janv. 1992
1.028 mds
+180.524 mln.
21.29%
1 janv. 1993
1.105 mds
+76.937 mln.
7.48%
1 janv. 1994
1.197 mds
+91.315 mln.
8.26%
1 janv. 1995
1.292 mds
+95.22 mln.
7.96%
1 janv. 1996
1.302 mds
+9.877 mln.
0.76%
1 janv. 2011
5.291 mds
+3.989 mds
306.44%
1 janv. 2012
5.431 mds
+139.72 mln.
2.64%
1 janv. 2013
6.032 mds
+601.59 mln.
11.08%
1 janv. 2014
6.335 mds
+302.82 mln.
5.02%
1 janv. 2015
6.676 mds
+340.96 mln.
5.38%
1 janv. 2016
6.95 mds
+273.98 mln.
4.1%
Classement des pays selon les statistiques actuelles par années