29
/fr/
fr
AIzaSyAYiBZKx7MnpbEhh9jyipgxe19OcubqV5w
April 1, 2024
232800
Samoa
WSM
true
2
1
Services, etc., value added (current LCU)
2016,2015,2014,2013,2012,2011,2010,2009,2008,2007,2006,2005,2004,2003,2002,2001,2000,1999,1998,1997,1996,1995
Download
Bibliothèque de statistiques globales →Samoa →

Services, etc., value added (current LCU)

Cette statistique dans les autres pays:
AfghanistanAlbaniaAlgeriaAndorraAngolaAntigua and BarbudaArgentinaArmeniaArubaAustraliaAustriaAzerbaijanBahamas, TheBahrainBangladeshBarbadosBelarusBelgiumBelizeBeninBermudaBhutanBoliviaBosnia and HerzegovinaBotswanaBrazilBrunei DarussalamBulgariaBurkina FasoBurundiCabo VerdeCambodiaCameroonCanadaCentral African RepublicChadChileChinaColombiaComorosCongo, Dem. Rep.Congo, Rep.Costa RicaCote d'IvoireCroatiaCubaCyprusCzech RepublicDenmarkDjiboutiDominicaDominican RepublicEcuadorEgypt, Arab Rep.El SalvadorEquatorial GuineaEritreaEstoniaEthiopiaFaroe IslandsFijiFinlandFranceGabonGambia, TheGeorgiaGermanyGhanaGreeceGrenadaGuatemalaGuineaGuinea-BissauGuyanaHondurasHong Kong SAR, ChinaHungaryIcelandIndiaIndonesiaIran, Islamic Rep.IraqIrelandItalyJamaicaJapanJordanKazakhstanKenyaKiribatiKorea, Rep.KosovoKuwaitKyrgyz RepublicLao PDRLatviaLebanonLesothoLiberiaLibyaLithuaniaLuxembourgMacao SAR, ChinaMacedonia, FYRMadagascarMalawiMalaysiaMaldivesMaliMaltaMarshall IslandsMauritaniaMauritiusMexicoMicronesia, Fed. Sts.MoldovaMongoliaMontenegroMoroccoMozambiqueMyanmarNamibiaNepalNetherlandsNew CaledoniaNew ZealandNicaraguaNigerNigeriaNorwayOmanPakistanPalauPanamaPapua New GuineaParaguayPeruPhilippinesPolandPortugalPuerto RicoQatarRomaniaRussian FederationRwandaSamoaSao Tome and PrincipeSaudi ArabiaSenegalSerbiaSeychellesSierra LeoneSingaporeSlovak RepublicSloveniaSolomon IslandsSomaliaSouth AfricaSpainSri LankaSt. Kitts and NevisSt. LuciaSt. Vincent and the GrenadinesSudanSurinameSwazilandSwedenSwitzerlandSyrian Arab RepublicTajikistanTanzaniaThailandTimor-LesteTogoTongaTrinidad and TobagoTunisiaTurkeyTurkmenistanTuvaluUgandaUkraineUnited Arab EmiratesUnited KingdomUnited StatesUruguayUzbekistanVanuatuVenezuela, RBVietnamWest Bank and GazaYemen, Rep.ZambiaZimbabwe
La ligne de temps
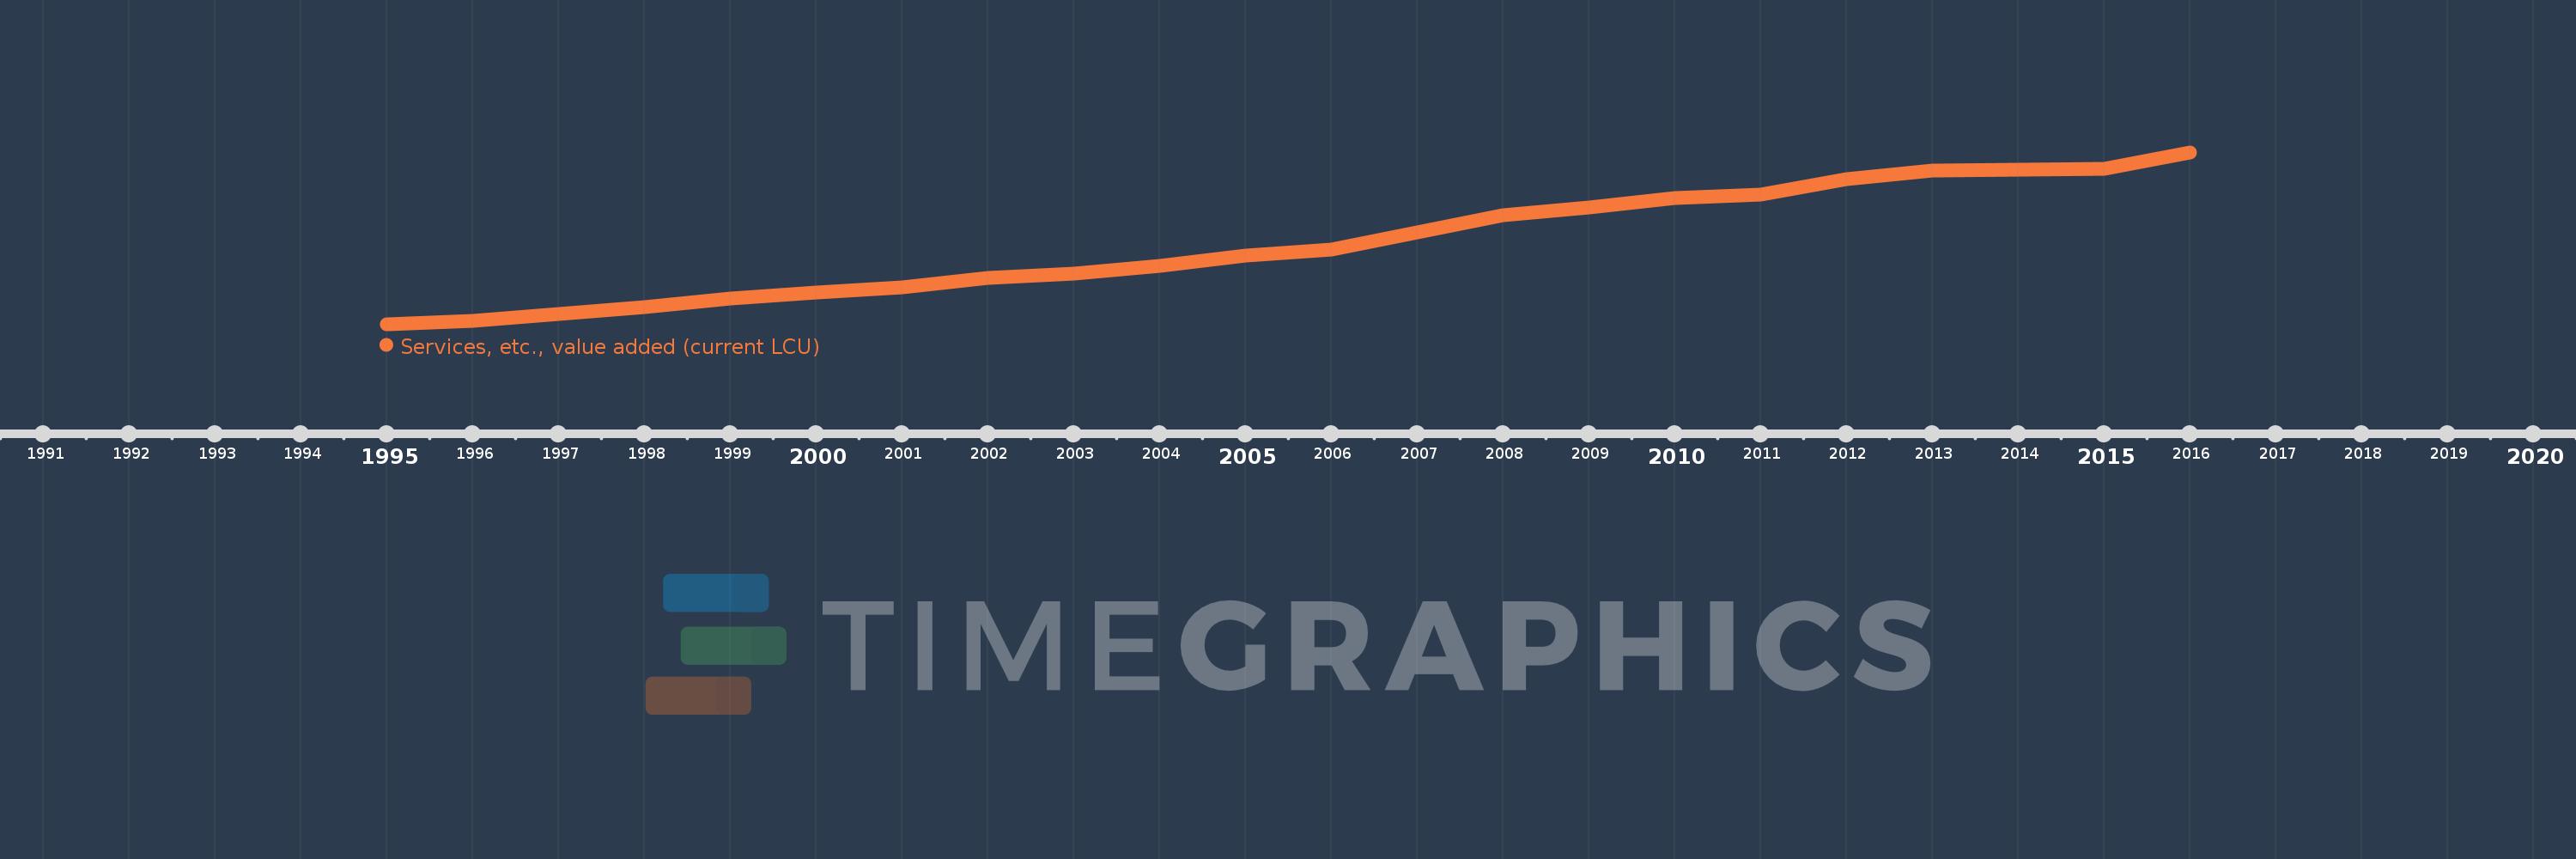
Cette échelle de temps montre un graphique de 1995 année à 2016 année Samoa. Les données jusqu'à 1994 année ne sont pas présentés. Quantité d'observations actuelles selon dates: 22.
Source (désignation):
Les indicateurs du développement mondiale
Source (organisation):
World Bank national accounts data, and OECD National Accounts data files.
Catégories:
Economy & Growth
Dernière mise à jour
23 avr. 2017
Les indicateurs de changement de valeurs selon les années
En moyenne:
750.864 mln.
Minimum:
271.658 mln.
1 janv. 1995
Maximum:
1.291 mds
1 janv. 2016
Pour la date d''observation
Valeur
Changement absolu
Le changement par rapport à la valeur précédente
1 janv. 1995
271.658 mln.
+271.658 mln.
0.0%
1 janv. 1996
290.657 mln.
+18.999 mln.
6.99%
1 janv. 1997
331.727 mln.
+41.071 mln.
14.13%
1 janv. 1998
373.283 mln.
+41.556 mln.
12.53%
1 janv. 1999
421.637 mln.
+48.355 mln.
12.95%
1 janv. 2000
457.651 mln.
+36.014 mln.
8.54%
1 janv. 2001
492.055 mln.
+34.404 mln.
7.52%
1 janv. 2002
546.669 mln.
+54.614 mln.
11.1%
1 janv. 2003
573.679 mln.
+27.01 mln.
4.94%
1 janv. 2004
615.575 mln.
+41.896 mln.
7.3%
1 janv. 2005
677.021 mln.
+61.447 mln.
9.98%
1 janv. 2006
713.855 mln.
+36.833 mln.
5.44%
1 janv. 2007
817.749 mln.
+103.894 mln.
14.55%
1 janv. 2008
919.65 mln.
+101.902 mln.
12.46%
1 janv. 2009
964.059 mln.
+44.409 mln.
4.83%
1 janv. 2010
1.02 mds
+55.995 mln.
5.81%
1 janv. 2011
1.041 mds
+21.068 mln.
2.07%
1 janv. 2012
1.131 mds
+89.433 mln.
8.59%
1 janv. 2013
1.185 mds
+54.657 mln.
4.83%
1 janv. 2014
1.19 mds
+4.564 mln.
0.39%
1 janv. 2015
1.195 mds
+5.008 mln.
0.42%
1 janv. 2016
1.291 mds
+95.801 mln.
8.02%
Classement des pays selon les statistiques actuelles par années

Commentaires:

Envoyer
PremiumAbout & FeedbackUn accordConfidentialité
logo
© 2022 Selected Technologies LLC – Morgan Hill, California