29
/fr/
fr
AIzaSyAYiBZKx7MnpbEhh9jyipgxe19OcubqV5w
April 1, 2024
75712
Azerbaijan
AZE
true
2
1
Services, etc., value added (constant LCU)
2016,2015,2014,2013,2012,2011,2010,2009,2008,2007,2006,2005,2004,2003,2002,2001,2000,1999,1998,1997,1996,1995,1994,1993
Download
Bibliothèque de statistiques globales →Azerbaijan →

Services, etc., value added (constant LCU)

Cette statistique dans les autres pays:
AfghanistanAlbaniaAlgeriaAntigua and BarbudaArgentinaArmeniaAustraliaAustriaAzerbaijanBahamas, TheBahrainBangladeshBelarusBelgiumBelizeBeninBermudaBhutanBoliviaBosnia and HerzegovinaBotswanaBrazilBrunei DarussalamBulgariaBurkina FasoBurundiCabo VerdeCambodiaCameroonCanadaCentral African RepublicChadChileChinaColombiaComorosCongo, Dem. Rep.Congo, Rep.Costa RicaCote d'IvoireCroatiaCubaCyprusCzech RepublicDenmarkDjiboutiDominicaDominican RepublicEcuadorEgypt, Arab Rep.El SalvadorEquatorial GuineaEritreaEstoniaEthiopiaFijiFinlandFranceGabonGambia, TheGeorgiaGermanyGhanaGreeceGrenadaGuatemalaGuineaGuinea-BissauGuyanaHaitiHondurasHong Kong SAR, ChinaHungaryIcelandIndiaIndonesiaIran, Islamic Rep.IraqIrelandItalyJamaicaJapanJordanKazakhstanKenyaKiribatiKorea, Rep.KosovoKuwaitKyrgyz RepublicLao PDRLatviaLebanonLesothoLiberiaLithuaniaLuxembourgMacedonia, FYRMadagascarMalawiMalaysiaMaldivesMaliMarshall IslandsMauritaniaMauritiusMexicoMicronesia, Fed. Sts.MoldovaMongoliaMontenegroMoroccoMozambiqueMyanmarNamibiaNepalNetherlandsNew ZealandNicaraguaNigerNigeriaNorwayOmanPakistanPalauPanamaPapua New GuineaParaguayPeruPhilippinesPolandPortugalPuerto RicoQatarRomaniaRussian FederationRwandaSamoaSao Tome and PrincipeSaudi ArabiaSenegalSerbiaSeychellesSierra LeoneSingaporeSlovak RepublicSloveniaSolomon IslandsSomaliaSouth AfricaSpainSri LankaSt. Kitts and NevisSt. LuciaSt. Vincent and the GrenadinesSudanSurinameSwazilandSwedenSwitzerlandSyrian Arab RepublicTajikistanTanzaniaThailandTimor-LesteTogoTongaTrinidad and TobagoTunisiaTurkeyTurkmenistanTuvaluUgandaUkraineUnited Arab EmiratesUnited KingdomUnited StatesUruguayUzbekistanVanuatuVenezuela, RBVietnamWest Bank and GazaZambiaZimbabwe
La ligne de temps
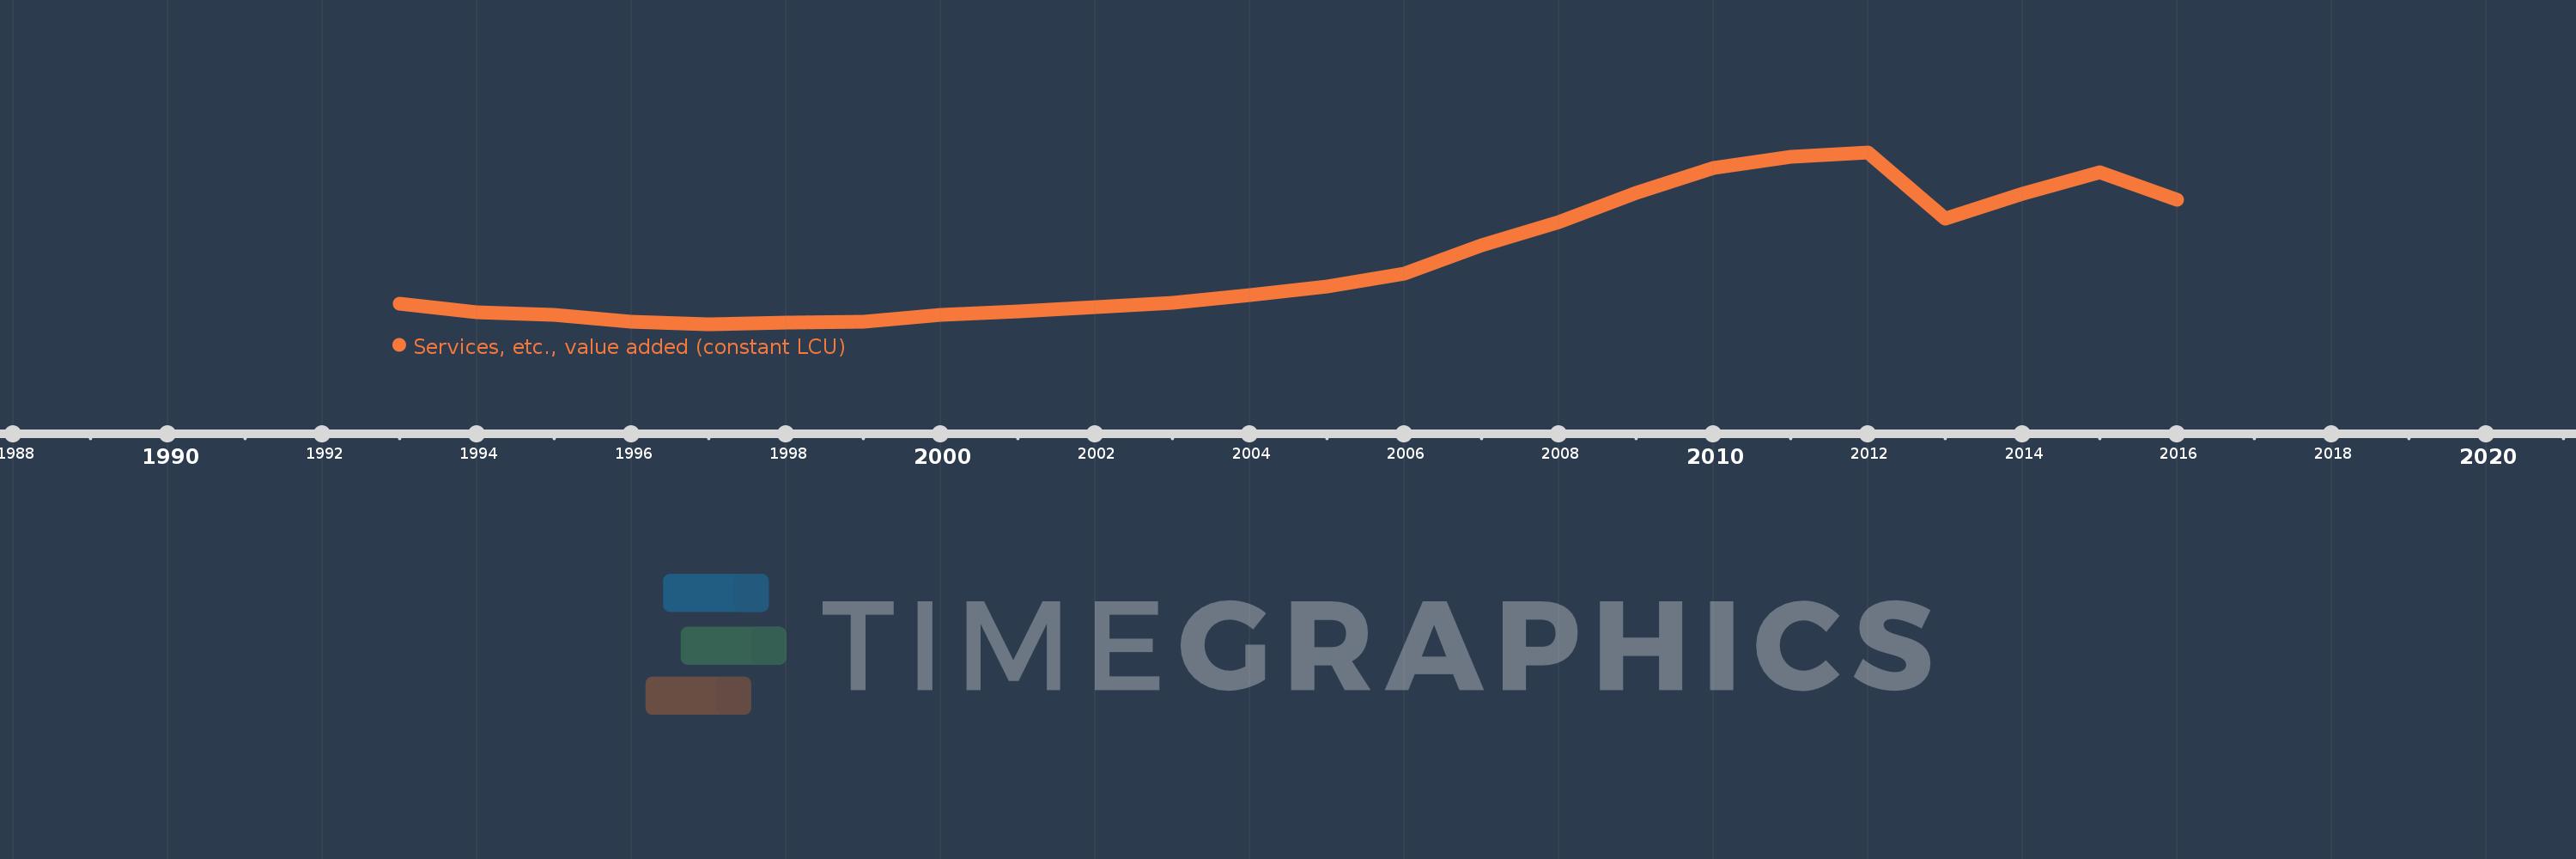
Cette échelle de temps montre un graphique de 1993 année à 2016 année Azerbaijan. Les données jusqu'à 1992 année ne sont pas présentés. Quantité d'observations actuelles selon dates: 24.
Source (désignation):
Les indicateurs du développement mondiale
Source (organisation):
World Bank national accounts data, and OECD National Accounts data files.
Catégories:
Economy & Growth
Dernière mise à jour
23 avr. 2017
Les indicateurs de changement de valeurs selon les années
En moyenne:
3.141 mds
Minimum:
1.297 mds
1 janv. 1997
Maximum:
6.215 mds
1 janv. 2012
Pour la date d''observation
Valeur
Changement absolu
Le changement par rapport à la valeur précédente
1 janv. 1993
1.873 mds
+1.873 mds
0.0%
1 janv. 1994
1.641 mds
-231.554 mln.
-12.37%
1 janv. 1995
1.564 mds
-76.934 mln.
-4.69%
1 janv. 1996
1.378 mds
-186.644 mln.
-11.93%
1 janv. 1997
1.297 mds
-80.999 mln.
-5.88%
1 janv. 1998
1.331 mds
+34.537 mln.
2.66%
1 janv. 1999
1.36 mds
+29.126 mln.
2.19%
1 janv. 2000
1.563 mds
+202.346 mln.
14.88%
1 janv. 2001
1.661 mds
+98.547 mln.
6.31%
1 janv. 2002
1.783 mds
+121.971 mln.
7.34%
1 janv. 2003
1.91 mds
+127.062 mln.
7.13%
1 janv. 2004
2.142 mds
+231.529 mln.
12.12%
1 janv. 2005
2.37 mds
+228.239 mln.
10.66%
1 janv. 2006
2.743 mds
+373.488 mln.
15.76%
1 janv. 2007
3.546 mds
+803.011 mln.
29.27%
1 janv. 2008
4.231 mds
+684.847 mln.
19.31%
1 janv. 2009
5.049 mds
+817.621 mln.
19.32%
1 janv. 2010
5.769 mds
+720.348 mln.
14.27%
1 janv. 2011
6.097 mds
+328.185 mln.
5.69%
1 janv. 2012
6.215 mds
+117.758 mln.
1.93%
1 janv. 2013
4.314 mds
-1.901 mds
-30.59%
1 janv. 2014
5.042 mds
+728.461 mln.
16.89%
1 janv. 2015
5.64 mds
+597.78 mln.
11.86%
1 janv. 2016
4.866 mds
-774.051 mln.
-13.72%
Classement des pays selon les statistiques actuelles par années

Commentaires:

Envoyer
PremiumAbout & FeedbackUn accordConfidentialité
logo
© 2022 Selected Technologies LLC – Morgan Hill, California