33
/fr/
AIzaSyAYiBZKx7MnpbEhh9jyipgxe19OcubqV5w
August 1, 2025
232799
Samoa
WSM
true
2
1
Services, etc., value added (constant LCU)
2016,2015,2014,2013,2012,2011,2010,2009,2008,2007,2006,2005,2004,2003,2002,2001,2000,1999,1998,1997,1996,1995
Download
Bibliothèque de statistiques globales →Samoa →

Services, etc., value added (constant LCU)

Cette statistique dans les autres pays:

AfghanistanAlbaniaAlgeriaAntigua and BarbudaArgentinaArmeniaAustraliaAustriaAzerbaijanBahamas, TheBahrainBangladeshBelarusBelgiumBelizeBeninBermudaBhutanBoliviaBosnia and HerzegovinaBotswanaBrazilBrunei DarussalamBulgariaBurkina FasoBurundiCabo VerdeCambodiaCameroonCanadaCentral African RepublicChadChileChinaColombiaComorosCongo, Dem. Rep.Congo, Rep.Costa RicaCote d'IvoireCroatiaCubaCyprusCzech RepublicDenmarkDjiboutiDominicaDominican RepublicEcuadorEgypt, Arab Rep.El SalvadorEquatorial GuineaEritreaEstoniaEthiopiaFijiFinlandFranceGabonGambia, TheGeorgiaGermanyGhanaGreeceGrenadaGuatemalaGuineaGuinea-BissauGuyanaHaitiHondurasHong Kong SAR, ChinaHungaryIcelandIndiaIndonesiaIran, Islamic Rep.IraqIrelandItalyJamaicaJapanJordanKazakhstanKenyaKiribatiKorea, Rep.KosovoKuwaitKyrgyz RepublicLao PDRLatviaLebanonLesothoLiberiaLithuaniaLuxembourgMacedonia, FYRMadagascarMalawiMalaysiaMaldivesMaliMarshall IslandsMauritaniaMauritiusMexicoMicronesia, Fed. Sts.MoldovaMongoliaMontenegroMoroccoMozambiqueMyanmarNamibiaNepalNetherlandsNew ZealandNicaraguaNigerNigeriaNorwayOmanPakistanPalauPanamaPapua New GuineaParaguayPeruPhilippinesPolandPortugalPuerto RicoQatarRomaniaRussian FederationRwandaSamoaSao Tome and PrincipeSaudi ArabiaSenegalSerbiaSeychellesSierra LeoneSingaporeSlovak RepublicSloveniaSolomon IslandsSomaliaSouth AfricaSpainSri LankaSt. Kitts and NevisSt. LuciaSt. Vincent and the GrenadinesSudanSurinameSwazilandSwedenSwitzerlandSyrian Arab RepublicTajikistanTanzaniaThailandTimor-LesteTogoTongaTrinidad and TobagoTunisiaTurkeyTurkmenistanTuvaluUgandaUkraineUnited Arab EmiratesUnited KingdomUnited StatesUruguayUzbekistanVanuatuVenezuela, RBVietnamWest Bank and GazaZambiaZimbabwe

La ligne de temps

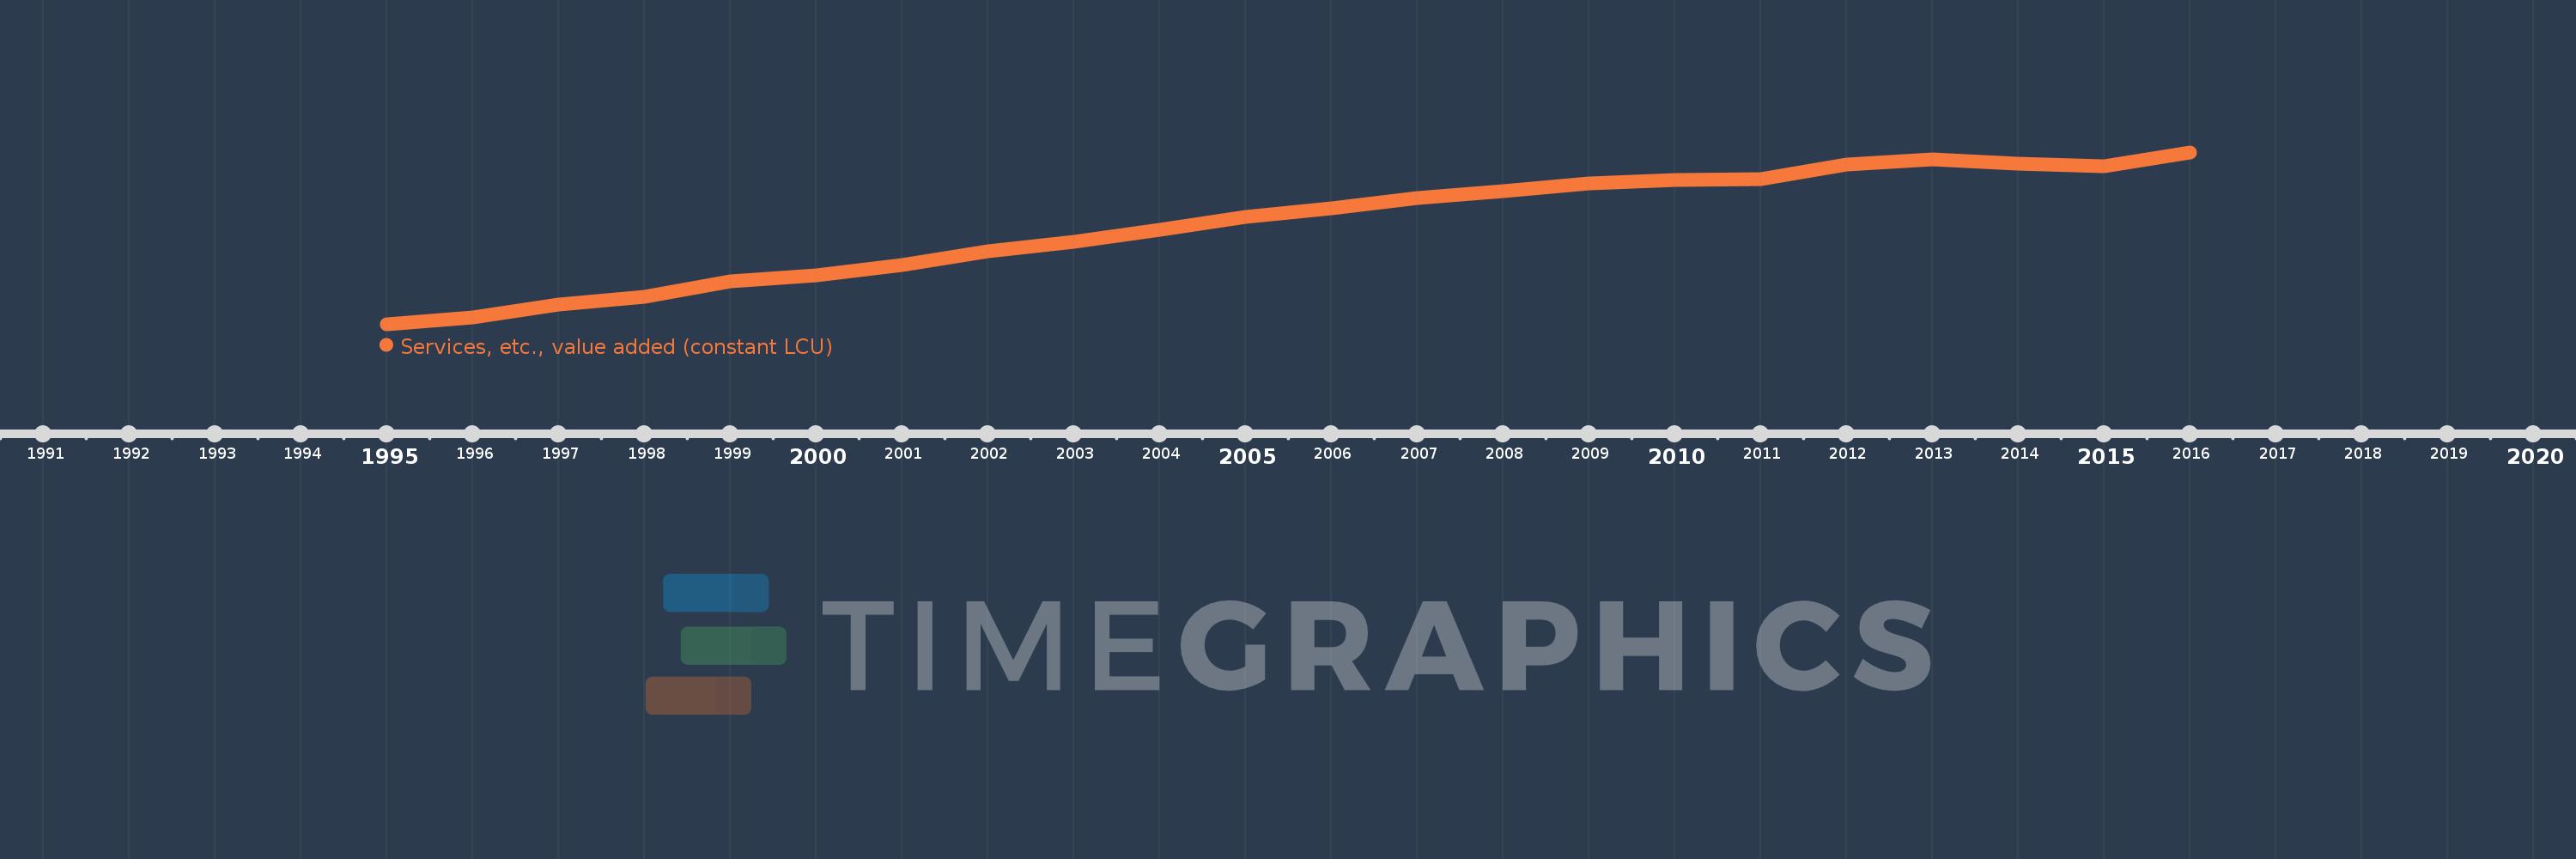
Cette échelle de temps montre un graphique de 1995 année à 2016 année Samoa. Les données jusqu'à 1994 année ne sont pas présentés. Quantité d'observations actuelles selon dates: 22.

Source (désignation):

Les indicateurs du développement mondiale

Source (organisation):

World Bank national accounts data, and OECD National Accounts data files.

Catégories:

Economy & Growth

Dernière mise à jour

23 avr. 2017

Les indicateurs de changement de valeurs selon les années

En moyenne:
838.538 mln.
Minimum:
441.268 mln.
1 janv. 1995
Maximum:
1.129 mds
1 janv. 2016
Pour la date d''observation
Valeur
Changement absolu
Le changement par rapport à la valeur précédente
1 janv. 1995
441.268 mln.
+441.268 mln.
0.0%
1 janv. 1996
469.788 mln.
+28.52 mln.
6.46%
1 janv. 1997
520.768 mln.
+50.98 mln.
10.85%
1 janv. 1998
550.636 mln.
+29.868 mln.
5.74%
1 janv. 1999
611.808 mln.
+61.172 mln.
11.11%
1 janv. 2000
637.097 mln.
+25.289 mln.
4.13%
1 janv. 2001
679.059 mln.
+41.962 mln.
6.59%
1 janv. 2002
731.977 mln.
+52.918 mln.
7.79%
1 janv. 2003
772.381 mln.
+40.403 mln.
5.52%
1 janv. 2004
819.519 mln.
+47.138 mln.
6.1%
1 janv. 2005
872.296 mln.
+52.777 mln.
6.44%
1 janv. 2006
904.298 mln.
+32.002 mln.
3.67%
1 janv. 2007
945.176 mln.
+40.878 mln.
4.52%
1 janv. 2008
974.831 mln.
+29.655 mln.
3.14%
1 janv. 2009
1.005 mds
+30.151 mln.
3.09%
1 janv. 2010
1.02 mds
+15.072 mln.
1.5%
1 janv. 2011
1.022 mds
+1.728 mln.
0.17%
1 janv. 2012
1.081 mds
+59.144 mln.
5.79%
1 janv. 2013
1.1 mds
+19.445 mln.
1.8%
1 janv. 2014
1.086 mds
-14.673 mln.
-1.33%
1 janv. 2015
1.074 mds
-11.943 mln.
-1.1%
1 janv. 2016
1.129 mds
+55.605 mln.
5.18%

Classement des pays selon les statistiques actuelles par années