33
/fr/
AIzaSyAYiBZKx7MnpbEhh9jyipgxe19OcubqV5w
August 1, 2025
75489
Azerbaijan
AZE
true
2
1
Physicians (per 1,000 people)
2014,2013,2012,2011,2010,2008,2007,2004,2002,2001,2000,1999,1998,1997,1996,1995,1994,1993,1992,1991,1990,1989,1988,1987,1986,1981
Download
Bibliothèque de statistiques globales →Azerbaijan →

Physicians (per 1,000 people)

Cette statistique dans les autres pays:

AfghanistanAlbaniaAlgeriaAmerican SamoaAndorraAngolaAntigua and BarbudaArab WorldArgentinaArmeniaArubaAustraliaAustriaAzerbaijanBahamas, TheBahrainBangladeshBarbadosBelarusBelgiumBelizeBeninBermudaBhutanBoliviaBosnia and HerzegovinaBotswanaBrazilBrunei DarussalamBulgariaBurkina FasoBurundiCabo VerdeCambodiaCameroonCanadaCaribbean small statesCayman IslandsCentral African RepublicCentral Europe and the BalticsChadChannel IslandsChileChinaColombiaComorosCongo, Dem. Rep.Congo, Rep.Costa RicaCote d'IvoireCroatiaCubaCyprusCzech RepublicDenmarkDjiboutiDominicaDominican RepublicEarly-demographic dividendEast Asia & PacificEast Asia & Pacific (excluding high income)East Asia & Pacific (IDA & IBRD countries)EcuadorEgypt, Arab Rep.El SalvadorEquatorial GuineaEritreaEstoniaEthiopiaEuro areaEurope & Central AsiaEurope & Central Asia (excluding high income)Europe & Central Asia (IDA & IBRD countries)European UnionFijiFinlandFragile and conflict affected situationsFranceFrench PolynesiaGabonGambia, TheGeorgiaGermanyGhanaGreeceGreenlandGrenadaGuamGuatemalaGuineaGuinea-BissauGuyanaHaitiHeavily indebted poor countries (HIPC)High incomeHondurasHong Kong SAR, ChinaHungaryIBRD onlyIcelandIDA & IBRD totalIDA blendIDA onlyIDA totalIndiaIndonesiaIran, Islamic Rep.IraqIrelandIsraelItalyJamaicaJapanJordanKazakhstanKenyaKiribatiKorea, Dem. People’s Rep.Korea, Rep.KuwaitKyrgyz RepublicLao PDRLate-demographic dividendLatin America & Caribbean Latin America & Caribbean (excluding high income)Latin America & the Caribbean (IDA & IBRD countries)LatviaLeast developed countries: UN classificationLebanonLesothoLiberiaLibyaLithuaniaLow & middle incomeLow incomeLower middle incomeLuxembourgMacao SAR, ChinaMacedonia, FYRMadagascarMalawiMalaysiaMaldivesMaliMaltaMarshall IslandsMauritaniaMauritiusMexicoMicronesia, Fed. Sts.Middle East & North AfricaMiddle East & North Africa (excluding high income)Middle East & North Africa (IDA & IBRD countries)Middle incomeMoldovaMonacoMongoliaMontenegroMoroccoMozambiqueMyanmarNamibiaNauruNepalNetherlandsNew CaledoniaNew ZealandNicaraguaNigerNigeriaNorth AmericaNorthern Mariana IslandsNorwayOECD membersOmanOther small statesPacific island small statesPakistanPalauPanamaPapua New GuineaParaguayPeruPhilippinesPolandPortugalPost-demographic dividendPre-demographic dividendPuerto RicoQatarRomaniaRussian FederationRwandaSamoaSan MarinoSao Tome and PrincipeSaudi ArabiaSenegalSerbiaSeychellesSierra LeoneSingaporeSlovak RepublicSloveniaSmall statesSolomon IslandsSomaliaSouth AfricaSouth AsiaSouth Asia (IDA & IBRD)SpainSri LankaSt. Kitts and NevisSt. LuciaSt. Vincent and the GrenadinesSub-Saharan Africa Sub-Saharan Africa (excluding high income)Sub-Saharan Africa (IDA & IBRD countries)SudanSurinameSwazilandSwedenSwitzerlandSyrian Arab RepublicTajikistanTanzaniaThailandTimor-LesteTogoTongaTrinidad and TobagoTunisiaTurkeyTurkmenistanTuvaluUgandaUkraineUnited Arab EmiratesUnited KingdomUnited StatesUpper middle incomeUruguayUzbekistanVanuatuVenezuela, RBVietnamVirgin Islands (U.S.)West Bank and GazaWorldYemen, Rep.ZambiaZimbabwe

La ligne de temps

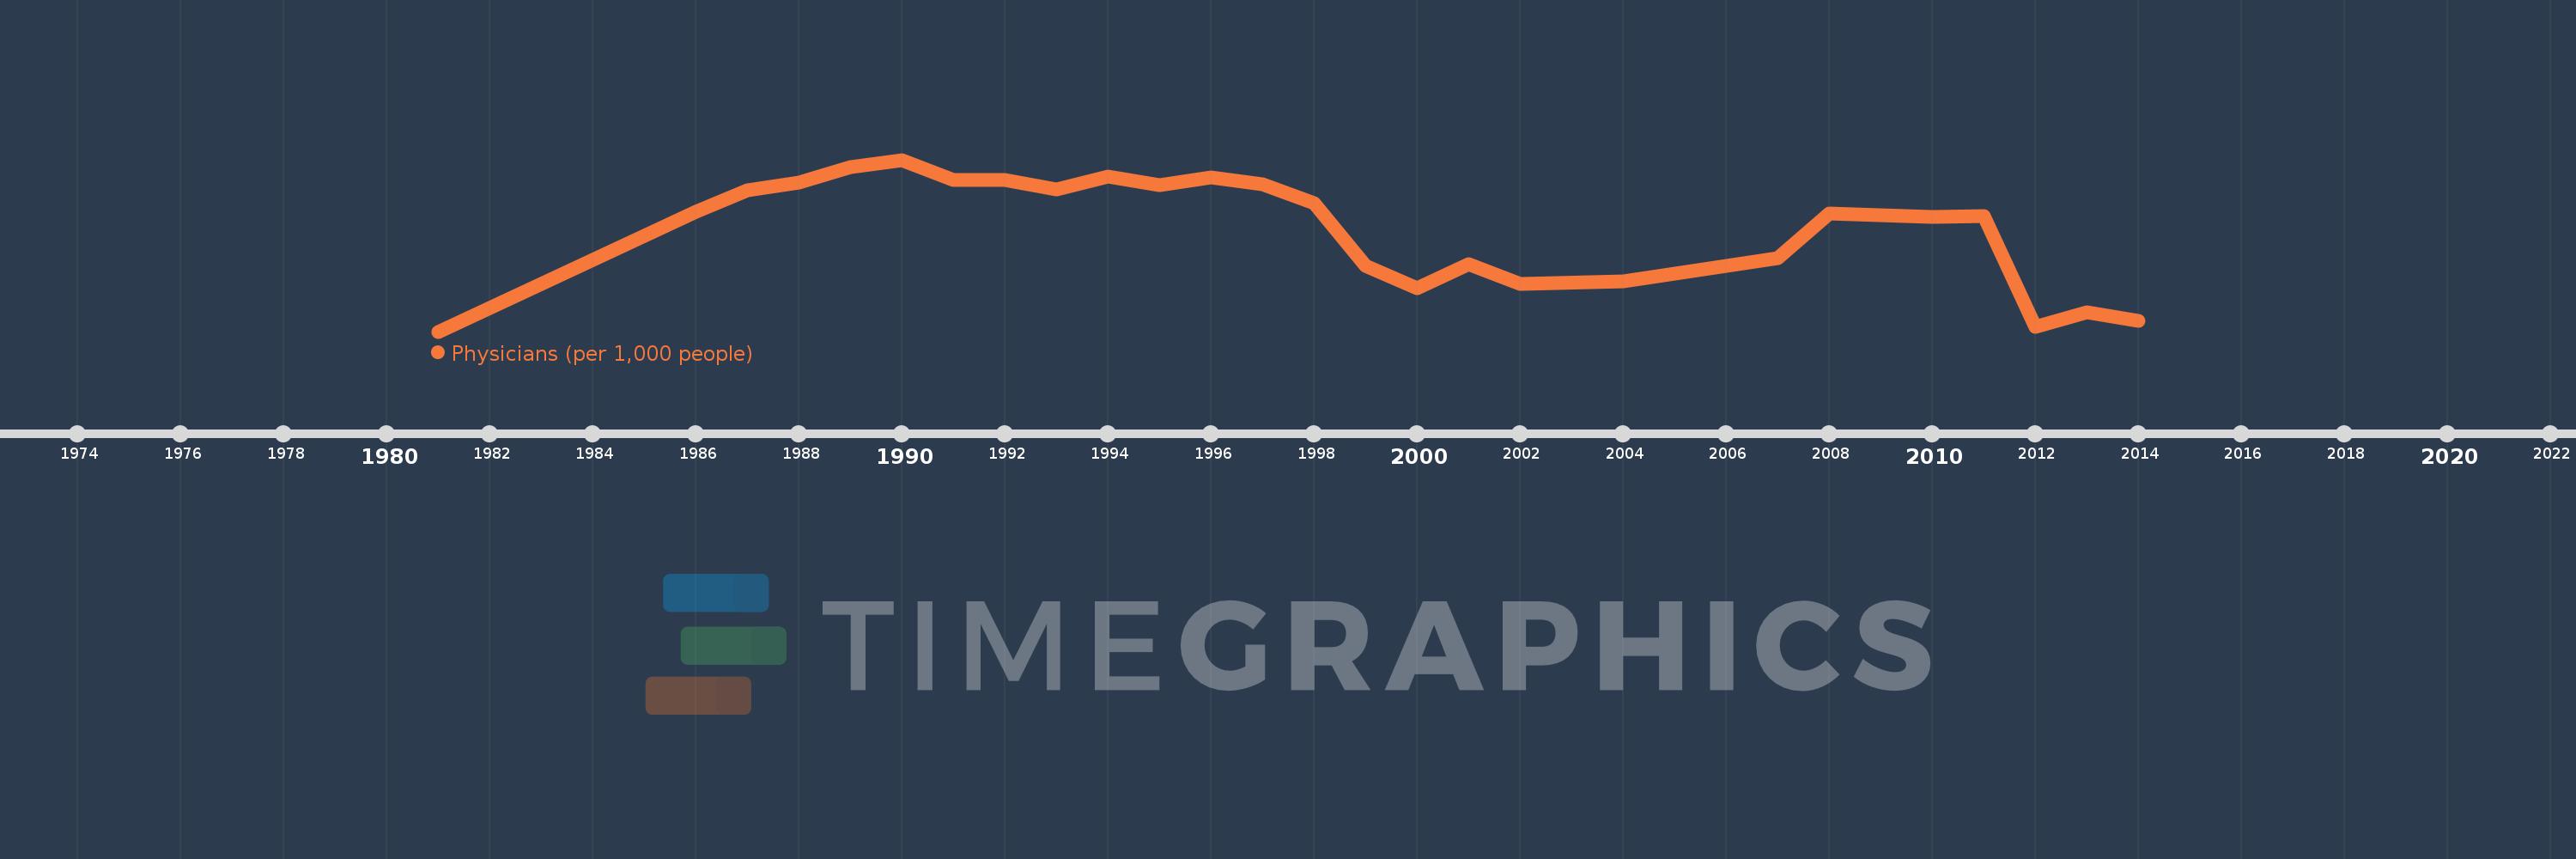
Cette échelle de temps montre un graphique de 1981 année à 2014 année Azerbaijan. Les données jusqu'à 1980 année ne sont pas présentés. Quantité d'observations actuelles selon dates: 26.

Source (désignation):

Les indicateurs du développement mondiale

Source (organisation):

World Health Organization's Global Health Workforce Statistics, OECD, supplemented by country data.

Catégories:

Health

Dernière mise à jour

23 avr. 2017

Les indicateurs de changement de valeurs selon les années

En moyenne:
3.735
Minimum:
3.362
1 janv. 1981
Maximum:
3.99
1 janv. 1990
Pour la date d''observation
Valeur
Changement absolu
Le changement par rapport à la valeur précédente
1 janv. 1981
3.362
+3.362
0.0%
1 janv. 1986
3.799
+0.437
13.01%
1 janv. 1987
3.877
+0.078
2.05%
1 janv. 1988
3.906
+0.029
0.75%
1 janv. 1989
3.964
+0.057
1.47%
1 janv. 1990
3.99
+0.026
0.67%
1 janv. 1991
3.917
-0.073
-1.82%
1 janv. 1992
3.916
-0.001
-0.02%
1 janv. 1993
3.881
-0.035
-0.9%
1 janv. 1994
3.928
+0.046
1.2%
1 janv. 1995
3.896
-0.032
-0.8%
1 janv. 1996
3.925
+0.029
0.74%
1 janv. 1997
3.899
-0.026
-0.66%
1 janv. 1998
3.831
-0.068
-1.74%
1 janv. 1999
3.602
-0.229
-5.98%
1 janv. 2000
3.521
-0.081
-2.25%
1 janv. 2001
3.607
+0.086
2.44%
1 janv. 2002
3.536
-0.071
-1.97%
1 janv. 2004
3.547
+0.011
0.31%
1 janv. 2007
3.63
+0.083
2.34%
1 janv. 2008
3.794
+0.164
4.52%
1 janv. 2010
3.782
-0.012
-0.32%
1 janv. 2011
3.785
+0.003
0.08%
1 janv. 2012
3.379
-0.406
-10.73%
1 janv. 2013
3.432
+0.053
1.57%
1 janv. 2014
3.402
-0.03
-0.87%

Classement des pays selon les statistiques actuelles par années