33
/fr/
AIzaSyB4mHJ5NPEv-XzF7P6NDYXjlkCWaeKw5bc
November 30, 2025
73338
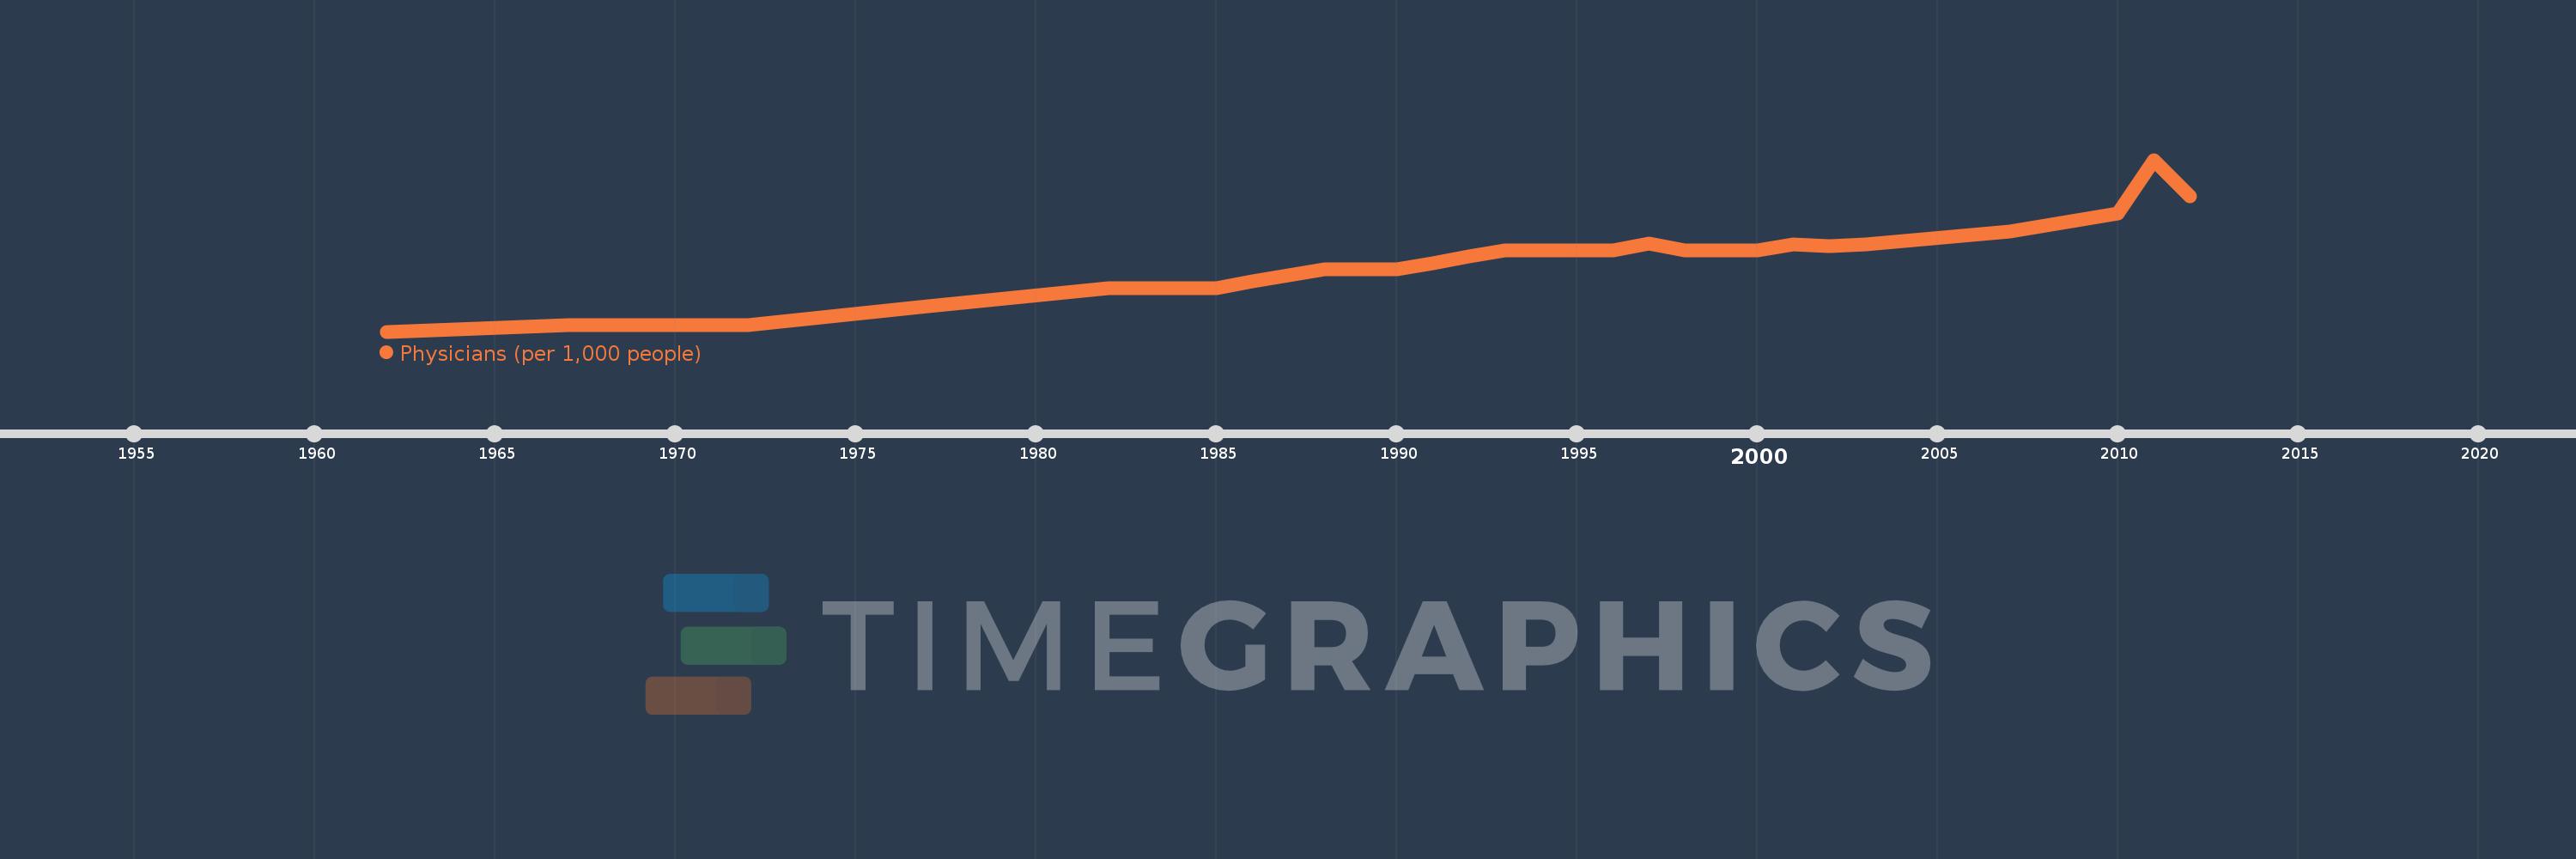
Australia
AUS
true
2
1
Physicians (per 1,000 people)
2012,2011,2010,2007,2003,2002,2001,2000,1999,1998,1997,1996,1995,1994,1993,1992,1991,1990,1989,1988,1987,1986,1985,1982,1977,1972,1967,1962