29
/fr/
fr
AIzaSyAYiBZKx7MnpbEhh9jyipgxe19OcubqV5w
April 1, 2024
75152
Azerbaijan
AZE
true
2
1
Industry, value added (constant LCU)
2016,2015,2014,2013,2012,2011,2010,2009,2008,2007,2006,2005,2004,2003,2002,2001,2000,1999,1998,1997,1996,1995,1994,1993
Download
Bibliothèque de statistiques globales →Azerbaijan →

Industry, value added (constant LCU)

Cette statistique dans les autres pays:
AfghanistanAlbaniaAlgeriaAntigua and BarbudaArgentinaArmeniaAustraliaAustriaAzerbaijanBahamas, TheBahrainBangladeshBelarusBelgiumBelizeBeninBermudaBhutanBoliviaBosnia and HerzegovinaBotswanaBrazilBrunei DarussalamBulgariaBurkina FasoBurundiCabo VerdeCambodiaCameroonCanadaCayman IslandsCentral African RepublicChadChileChinaColombiaComorosCongo, Dem. Rep.Congo, Rep.Costa RicaCote d'IvoireCroatiaCubaCyprusCzech RepublicDenmarkDjiboutiDominicaDominican RepublicEcuadorEgypt, Arab Rep.El SalvadorEquatorial GuineaEritreaEstoniaEthiopiaFijiFinlandFranceGabonGambia, TheGeorgiaGermanyGhanaGreeceGrenadaGuatemalaGuineaGuinea-BissauGuyanaHaitiHondurasHong Kong SAR, ChinaHungaryIcelandIndiaIndonesiaIran, Islamic Rep.IraqIrelandItalyJamaicaJapanJordanKazakhstanKenyaKiribatiKorea, Rep.KosovoKuwaitKyrgyz RepublicLao PDRLatviaLebanonLesothoLiberiaLithuaniaLuxembourgMacedonia, FYRMadagascarMalawiMalaysiaMaldivesMaliMarshall IslandsMauritaniaMauritiusMexicoMicronesia, Fed. Sts.MoldovaMongoliaMontenegroMoroccoMozambiqueMyanmarNamibiaNepalNetherlandsNew ZealandNicaraguaNigerNigeriaNorwayOmanPakistanPalauPanamaPapua New GuineaParaguayPeruPhilippinesPolandPortugalPuerto RicoQatarRomaniaRussian FederationRwandaSamoaSao Tome and PrincipeSaudi ArabiaSenegalSerbiaSeychellesSierra LeoneSingaporeSlovak RepublicSloveniaSolomon IslandsSomaliaSouth AfricaSpainSri LankaSt. Kitts and NevisSt. LuciaSt. Vincent and the GrenadinesSudanSurinameSwazilandSwedenSwitzerlandSyrian Arab RepublicTajikistanTanzaniaThailandTimor-LesteTogoTongaTrinidad and TobagoTunisiaTurkeyTurkmenistanTuvaluUgandaUkraineUnited Arab EmiratesUnited KingdomUnited StatesUruguayUzbekistanVanuatuVenezuela, RBVietnamWest Bank and GazaZambiaZimbabwe
La ligne de temps
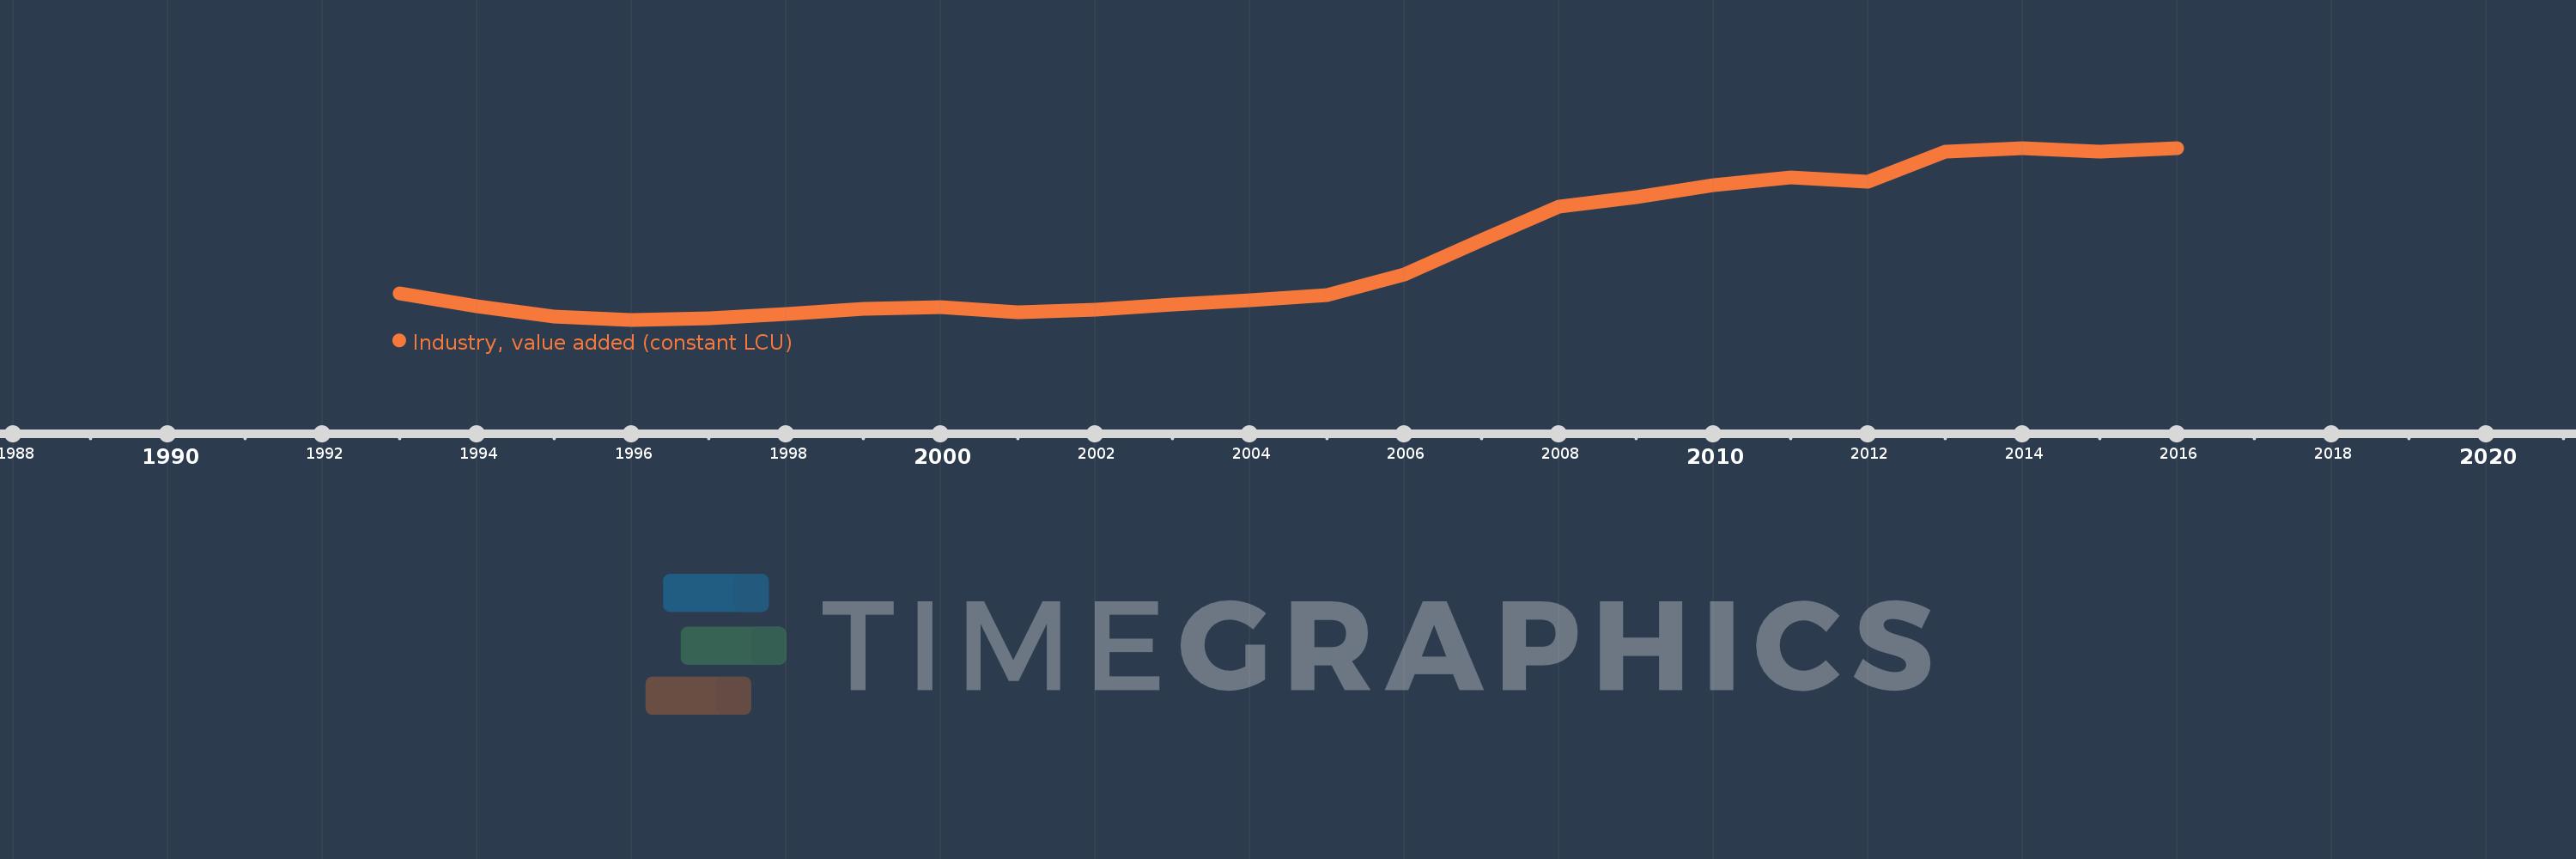
Cette échelle de temps montre un graphique de 1993 année à 2016 année Azerbaijan. Les données jusqu'à 1992 année ne sont pas présentés. Quantité d'observations actuelles selon dates: 24.
Source (désignation):
Les indicateurs du développement mondiale
Source (organisation):
World Bank national accounts data, and OECD National Accounts data files.
Catégories:
Economy & Growth
Dernière mise à jour
23 avr. 2017
Les indicateurs de changement de valeurs selon les années
En moyenne:
5.889 mds
Minimum:
1.513 mds
1 janv. 1996
Maximum:
12.736 mds
1 janv. 2014
Pour la date d''observation
Valeur
Changement absolu
Le changement par rapport à la valeur précédente
1 janv. 1993
3.208 mds
+3.208 mds
0.0%
1 janv. 1994
2.402 mds
-806.365 mln.
-25.13%
1 janv. 1995
1.747 mds
-654.661 mln.
-27.26%
1 janv. 1996
1.513 mds
-234.052 mln.
-13.4%
1 janv. 1997
1.624 mds
+110.415 mln.
7.3%
1 janv. 1998
1.911 mds
+287.842 mln.
17.73%
1 janv. 1999
2.254 mds
+342.277 mln.
17.91%
1 janv. 2000
2.313 mds
+59.41 mln.
2.64%
1 janv. 2001
2.007 mds
-306.198 mln.
-13.24%
1 janv. 2002
2.173 mds
+166.246 mln.
8.28%
1 janv. 2003
2.495 mds
+321.56 mln.
14.8%
1 janv. 2004
2.807 mds
+312.051 mln.
12.51%
1 janv. 2005
3.133 mds
+325.761 mln.
11.61%
1 janv. 2006
4.493 mds
+1.361 mds
43.44%
1 janv. 2007
6.696 mds
+2.203 mds
49.03%
1 janv. 2008
8.895 mds
+2.199 mds
32.83%
1 janv. 2009
9.505 mds
+610.068 mln.
6.86%
1 janv. 2010
10.286 mds
+780.911 mln.
8.22%
1 janv. 2011
10.827 mds
+541.249 mln.
5.26%
1 janv. 2012
10.549 mds
-277.51 mln.
-2.56%
1 janv. 2013
12.511 mds
+1.962 mds
18.6%
1 janv. 2014
12.736 mds
+225.203 mln.
1.8%
1 janv. 2015
12.52 mds
-216.52 mln.
-1.7%
1 janv. 2016
12.72 mds
+200.32 mln.
1.6%
Classement des pays selon les statistiques actuelles par années

Commentaires:

Envoyer
PremiumAbout & FeedbackUn accordConfidentialité
logo
© 2022 Selected Technologies LLC – Morgan Hill, California