29
/fr/
fr
AIzaSyAYiBZKx7MnpbEhh9jyipgxe19OcubqV5w
April 1, 2024
232336
Samoa
WSM
true
2
1
Industry, value added (constant LCU)
2016,2015,2014,2013,2012,2011,2010,2009,2008,2007,2006,2005,2004,2003,2002,2001,2000,1999,1998,1997,1996,1995
Download
Bibliothèque de statistiques globales →Samoa →

Industry, value added (constant LCU)

Cette statistique dans les autres pays:
AfghanistanAlbaniaAlgeriaAntigua and BarbudaArgentinaArmeniaAustraliaAustriaAzerbaijanBahamas, TheBahrainBangladeshBelarusBelgiumBelizeBeninBermudaBhutanBoliviaBosnia and HerzegovinaBotswanaBrazilBrunei DarussalamBulgariaBurkina FasoBurundiCabo VerdeCambodiaCameroonCanadaCayman IslandsCentral African RepublicChadChileChinaColombiaComorosCongo, Dem. Rep.Congo, Rep.Costa RicaCote d'IvoireCroatiaCubaCyprusCzech RepublicDenmarkDjiboutiDominicaDominican RepublicEcuadorEgypt, Arab Rep.El SalvadorEquatorial GuineaEritreaEstoniaEthiopiaFijiFinlandFranceGabonGambia, TheGeorgiaGermanyGhanaGreeceGrenadaGuatemalaGuineaGuinea-BissauGuyanaHaitiHondurasHong Kong SAR, ChinaHungaryIcelandIndiaIndonesiaIran, Islamic Rep.IraqIrelandItalyJamaicaJapanJordanKazakhstanKenyaKiribatiKorea, Rep.KosovoKuwaitKyrgyz RepublicLao PDRLatviaLebanonLesothoLiberiaLithuaniaLuxembourgMacedonia, FYRMadagascarMalawiMalaysiaMaldivesMaliMarshall IslandsMauritaniaMauritiusMexicoMicronesia, Fed. Sts.MoldovaMongoliaMontenegroMoroccoMozambiqueMyanmarNamibiaNepalNetherlandsNew ZealandNicaraguaNigerNigeriaNorwayOmanPakistanPalauPanamaPapua New GuineaParaguayPeruPhilippinesPolandPortugalPuerto RicoQatarRomaniaRussian FederationRwandaSamoaSao Tome and PrincipeSaudi ArabiaSenegalSerbiaSeychellesSierra LeoneSingaporeSlovak RepublicSloveniaSolomon IslandsSomaliaSouth AfricaSpainSri LankaSt. Kitts and NevisSt. LuciaSt. Vincent and the GrenadinesSudanSurinameSwazilandSwedenSwitzerlandSyrian Arab RepublicTajikistanTanzaniaThailandTimor-LesteTogoTongaTrinidad and TobagoTunisiaTurkeyTurkmenistanTuvaluUgandaUkraineUnited Arab EmiratesUnited KingdomUnited StatesUruguayUzbekistanVanuatuVenezuela, RBVietnamWest Bank and GazaZambiaZimbabwe
La ligne de temps
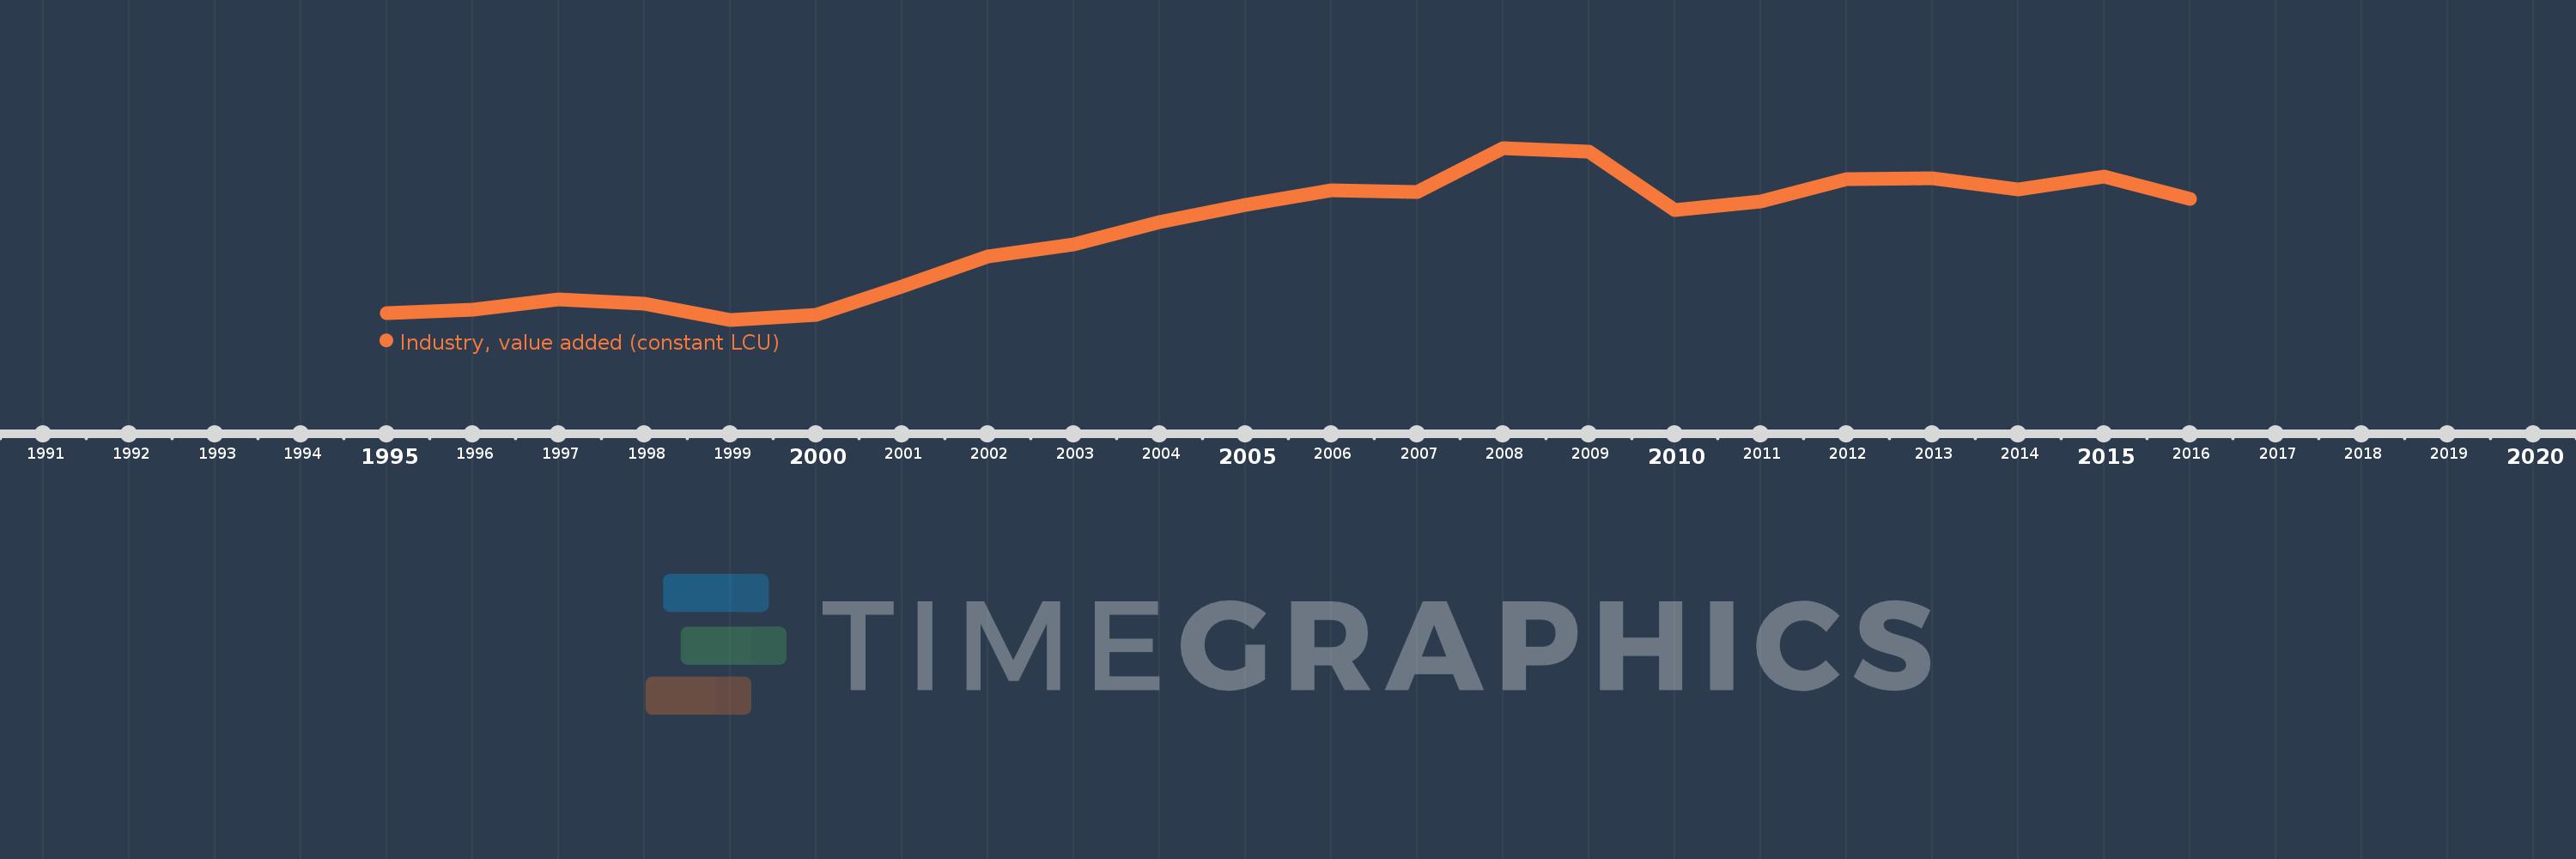
Cette échelle de temps montre un graphique de 1995 année à 2016 année Samoa. Les données jusqu'à 1994 année ne sont pas présentés. Quantité d'observations actuelles selon dates: 22.
Source (désignation):
Les indicateurs du développement mondiale
Source (organisation):
World Bank national accounts data, and OECD National Accounts data files.
Catégories:
Economy & Growth
Dernière mise à jour
23 avr. 2017
Les indicateurs de changement de valeurs selon les années
En moyenne:
369.897 mln.
Minimum:
258.154 mln.
1 janv. 1999
Maximum:
475.552 mln.
1 janv. 2008
Pour la date d''observation
Valeur
Changement absolu
Le changement par rapport à la valeur précédente
1 janv. 1995
266.426 mln.
+266.426 mln.
0.0%
1 janv. 1996
271.317 mln.
+4.891 mln.
1.84%
1 janv. 1997
283.968 mln.
+12.65 mln.
4.66%
1 janv. 1998
278.483 mln.
-5.484 mln.
-1.93%
1 janv. 1999
258.154 mln.
-20.33 mln.
-7.3%
1 janv. 2000
264.217 mln.
+6.063 mln.
2.35%
1 janv. 2001
300.118 mln.
+35.901 mln.
13.59%
1 janv. 2002
337.91 mln.
+37.791 mln.
12.59%
1 janv. 2003
353.723 mln.
+15.813 mln.
4.68%
1 janv. 2004
381.221 mln.
+27.498 mln.
7.77%
1 janv. 2005
403.763 mln.
+22.543 mln.
5.91%
1 janv. 2006
421.888 mln.
+18.125 mln.
4.49%
1 janv. 2007
419.85 mln.
-2.038 mln.
-0.48%
1 janv. 2008
475.552 mln.
+55.702 mln.
13.27%
1 janv. 2009
470.659 mln.
-4.894 mln.
-1.03%
1 janv. 2010
396.705 mln.
-73.953 mln.
-15.71%
1 janv. 2011
407.316 mln.
+10.611 mln.
2.67%
1 janv. 2012
436.569 mln.
+29.253 mln.
7.18%
1 janv. 2013
436.841 mln.
+272.0 milles
0.06%
1 janv. 2014
422.634 mln.
-14.207 mln.
-3.25%
1 janv. 2015
438.887 mln.
+16.253 mln.
3.85%
1 janv. 2016
411.522 mln.
-27.365 mln.
-6.24%
Classement des pays selon les statistiques actuelles par années

Commentaires:

Envoyer
PremiumAbout & FeedbackUn accordConfidentialité
logo
© 2022 Selected Technologies LLC – Morgan Hill, California