29
/fr/
fr
AIzaSyAYiBZKx7MnpbEhh9jyipgxe19OcubqV5w
April 1, 2024
74599
Azerbaijan
AZE
true
2
1
Agriculture, value added (constant LCU)
2016,2015,2014,2013,2012,2011,2010,2009,2008,2007,2006,2005,2004,2003,2002,2001,2000,1999,1998,1997,1996,1995,1994,1993
Download
Bibliothèque de statistiques globales →Azerbaijan →

Agriculture, value added (constant LCU)

Cette statistique dans les autres pays:
AfghanistanAlbaniaAlgeriaAntigua and BarbudaArgentinaArmeniaAustraliaAustriaAzerbaijanBahamas, TheBahrainBangladeshBelarusBelgiumBelizeBeninBermudaBhutanBoliviaBosnia and HerzegovinaBotswanaBrazilBrunei DarussalamBulgariaBurkina FasoBurundiCabo VerdeCambodiaCameroonCanadaCayman IslandsCentral African RepublicChadChileChinaColombiaComorosCongo, Dem. Rep.Congo, Rep.Costa RicaCote d'IvoireCroatiaCubaCyprusCzech RepublicDenmarkDjiboutiDominicaDominican RepublicEcuadorEgypt, Arab Rep.El SalvadorEquatorial GuineaEritreaEstoniaEthiopiaFijiFinlandFranceGabonGambia, TheGeorgiaGermanyGhanaGreeceGrenadaGuatemalaGuineaGuinea-BissauGuyanaHaitiHondurasHong Kong SAR, ChinaHungaryIcelandIndiaIndonesiaIran, Islamic Rep.IraqIrelandItalyJamaicaJapanJordanKazakhstanKenyaKiribatiKorea, Rep.KosovoKuwaitKyrgyz RepublicLao PDRLatviaLebanonLesothoLiberiaLithuaniaLuxembourgMacedonia, FYRMadagascarMalawiMalaysiaMaldivesMaliMarshall IslandsMauritaniaMauritiusMexicoMicronesia, Fed. Sts.MoldovaMongoliaMontenegroMoroccoMozambiqueMyanmarNamibiaNepalNetherlandsNew ZealandNicaraguaNigerNigeriaNorwayOmanPakistanPalauPanamaPapua New GuineaParaguayPeruPhilippinesPolandPortugalPuerto RicoQatarRomaniaRussian FederationRwandaSamoaSao Tome and PrincipeSaudi ArabiaSenegalSerbiaSeychellesSierra LeoneSingaporeSlovak RepublicSloveniaSolomon IslandsSomaliaSouth AfricaSpainSri LankaSt. Kitts and NevisSt. LuciaSt. Vincent and the GrenadinesSudanSurinameSwazilandSwedenSwitzerlandSyrian Arab RepublicTajikistanTanzaniaThailandTimor-LesteTogoTongaTrinidad and TobagoTunisiaTurkeyTurkmenistanTuvaluUgandaUkraineUnited Arab EmiratesUnited KingdomUnited StatesUruguayUzbekistanVanuatuVenezuela, RBVietnamWest Bank and GazaZambiaZimbabwe
La ligne de temps
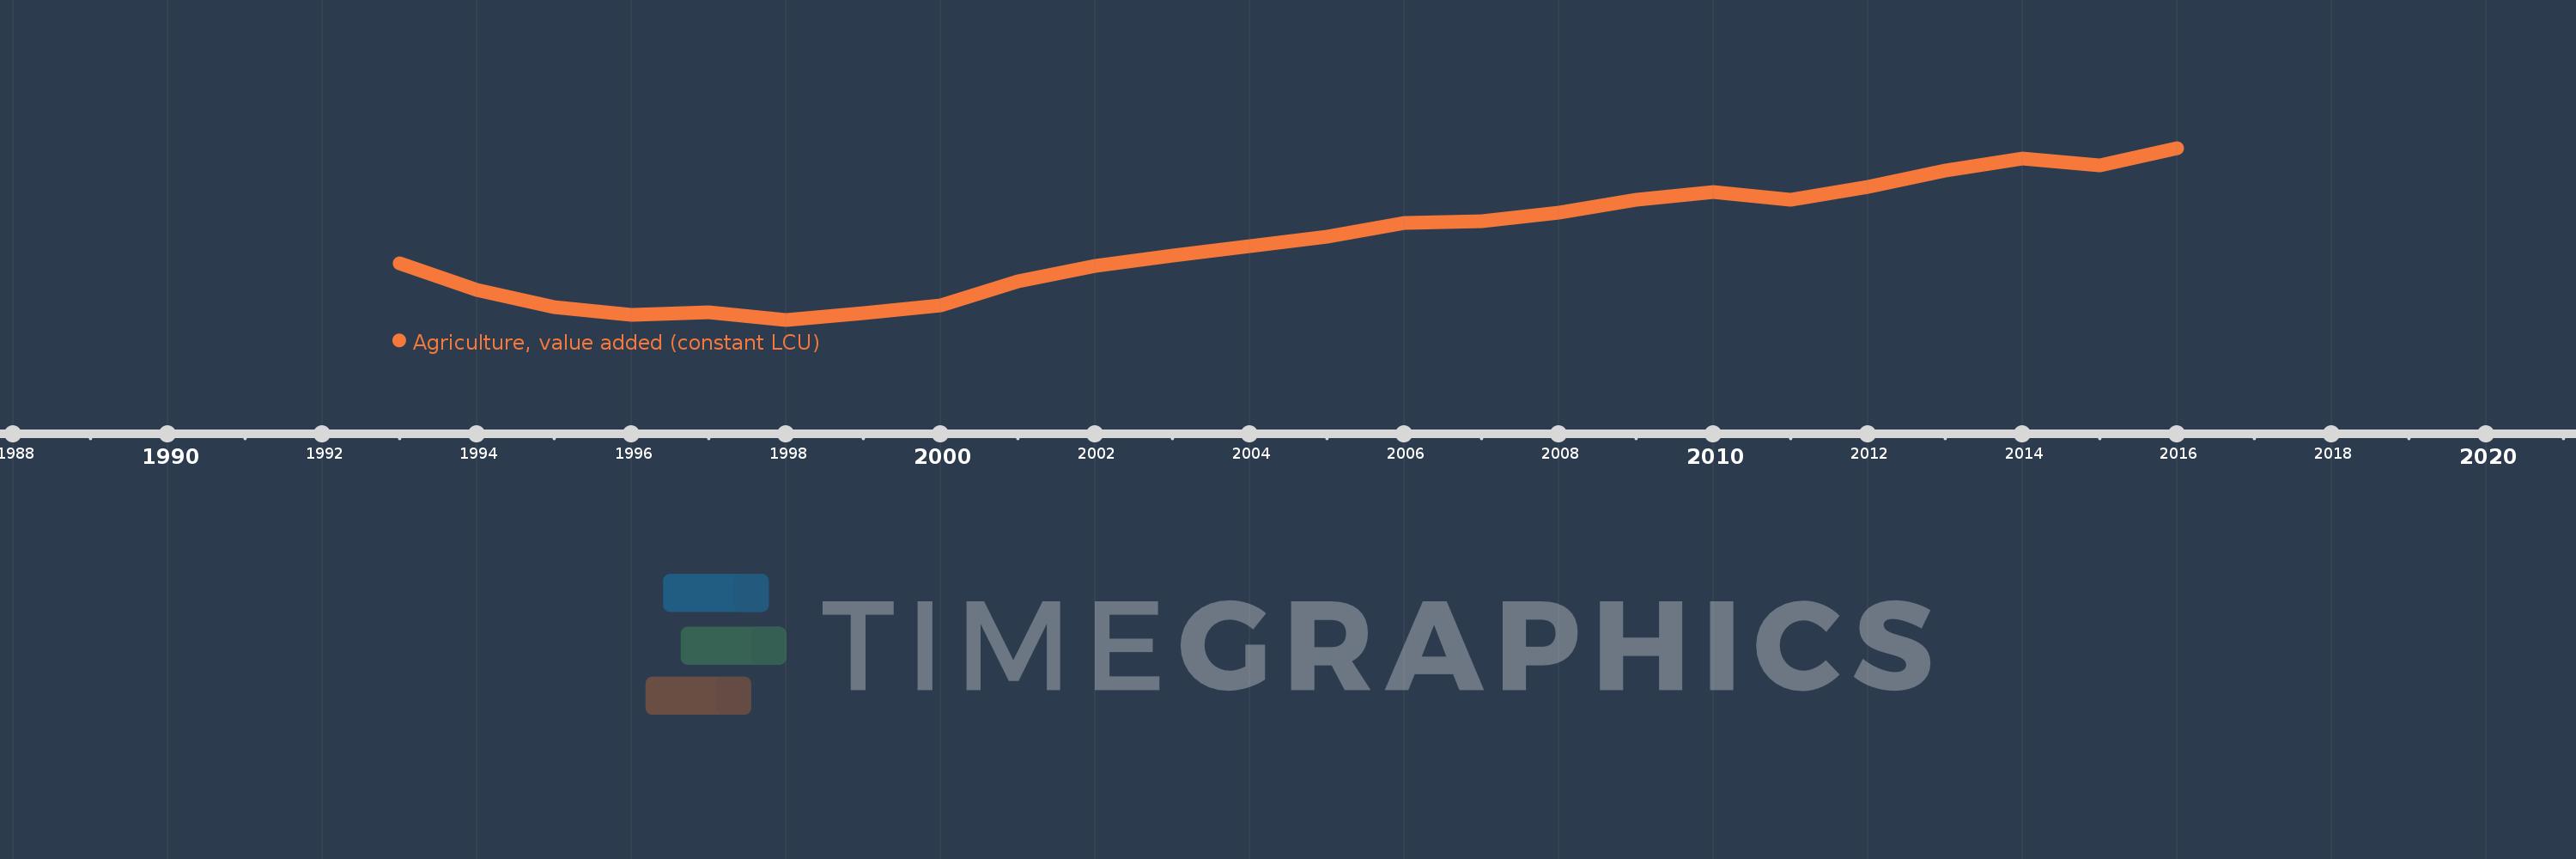
Cette échelle de temps montre un graphique de 1993 année à 2016 année Azerbaijan. Les données jusqu'à 1992 année ne sont pas présentés. Quantité d'observations actuelles selon dates: 24.
Source (désignation):
Les indicateurs du développement mondiale
Source (organisation):
World Bank national accounts data, and OECD National Accounts data files.
Catégories:
Economy & Growth
Dernière mise à jour
23 avr. 2017
Les indicateurs de changement de valeurs selon les années
En moyenne:
972.915 mln.
Minimum:
557.937 mln.
1 janv. 1998
Maximum:
1.465 mds
1 janv. 2016
Pour la date d''observation
Valeur
Changement absolu
Le changement par rapport à la valeur précédente
1 janv. 1993
857.183 mln.
+857.183 mln.
0.0%
1 janv. 1994
717.462 mln.
-139.721 mln.
-16.3%
1 janv. 1995
625.627 mln.
-91.835 mln.
-12.8%
1 janv. 1996
581.833 mln.
-43.794 mln.
-7.0%
1 janv. 1997
599.288 mln.
+17.455 mln.
3.0%
1 janv. 1998
557.937 mln.
-41.351 mln.
-6.9%
1 janv. 1999
592.529 mln.
+34.592 mln.
6.2%
1 janv. 2000
634.599 mln.
+42.07 mln.
7.1%
1 janv. 2001
758.9 mln.
+124.301 mln.
19.59%
1 janv. 2002
843.138 mln.
+84.238 mln.
11.1%
1 janv. 2003
897.099 mln.
+53.961 mln.
6.4%
1 janv. 2004
947.336 mln.
+50.238 mln.
5.6%
1 janv. 2005
994.703 mln.
+47.367 mln.
5.0%
1 janv. 2006
1.069 mds
+74.603 mln.
7.5%
1 janv. 2007
1.079 mds
+9.624 mln.
0.9%
1 janv. 2008
1.122 mds
+43.157 mln.
4.0%
1 janv. 2009
1.191 mds
+68.447 mln.
6.1%
1 janv. 2010
1.232 mds
+41.669 mln.
3.5%
1 janv. 2011
1.193 mds
-39.653 mln.
-3.22%
1 janv. 2012
1.262 mds
+69.168 mln.
5.8%
1 janv. 2013
1.345 mds
+83.273 mln.
6.6%
1 janv. 2014
1.411 mds
+65.905 mln.
4.9%
1 janv. 2015
1.374 mds
-36.683 mln.
-2.6%
1 janv. 2016
1.465 mds
+90.698 mln.
6.6%
Classement des pays selon les statistiques actuelles par années

Commentaires:

Envoyer
PremiumAbout & FeedbackUn accordConfidentialité
logo
© 2022 Selected Technologies LLC – Morgan Hill, California