29
/fr/
fr
AIzaSyAYiBZKx7MnpbEhh9jyipgxe19OcubqV5w
April 1, 2024
243336
Solomon Islands
SLB
true
2
1
Agriculture, value added (constant LCU)
2007,2006,2005,2004,2003,2002,2001,2000,1999,1998,1997,1996,1995,1994,1993,1992,1991
Download
Bibliothèque de statistiques globales →Solomon Islands →

Agriculture, value added (constant LCU)

Cette statistique dans les autres pays:
AfghanistanAlbaniaAlgeriaAntigua and BarbudaArgentinaArmeniaAustraliaAustriaAzerbaijanBahamas, TheBahrainBangladeshBelarusBelgiumBelizeBeninBermudaBhutanBoliviaBosnia and HerzegovinaBotswanaBrazilBrunei DarussalamBulgariaBurkina FasoBurundiCabo VerdeCambodiaCameroonCanadaCayman IslandsCentral African RepublicChadChileChinaColombiaComorosCongo, Dem. Rep.Congo, Rep.Costa RicaCote d'IvoireCroatiaCubaCyprusCzech RepublicDenmarkDjiboutiDominicaDominican RepublicEcuadorEgypt, Arab Rep.El SalvadorEquatorial GuineaEritreaEstoniaEthiopiaFijiFinlandFranceGabonGambia, TheGeorgiaGermanyGhanaGreeceGrenadaGuatemalaGuineaGuinea-BissauGuyanaHaitiHondurasHong Kong SAR, ChinaHungaryIcelandIndiaIndonesiaIran, Islamic Rep.IraqIrelandItalyJamaicaJapanJordanKazakhstanKenyaKiribatiKorea, Rep.KosovoKuwaitKyrgyz RepublicLao PDRLatviaLebanonLesothoLiberiaLithuaniaLuxembourgMacedonia, FYRMadagascarMalawiMalaysiaMaldivesMaliMarshall IslandsMauritaniaMauritiusMexicoMicronesia, Fed. Sts.MoldovaMongoliaMontenegroMoroccoMozambiqueMyanmarNamibiaNepalNetherlandsNew ZealandNicaraguaNigerNigeriaNorwayOmanPakistanPalauPanamaPapua New GuineaParaguayPeruPhilippinesPolandPortugalPuerto RicoQatarRomaniaRussian FederationRwandaSamoaSao Tome and PrincipeSaudi ArabiaSenegalSerbiaSeychellesSierra LeoneSingaporeSlovak RepublicSloveniaSolomon IslandsSomaliaSouth AfricaSpainSri LankaSt. Kitts and NevisSt. LuciaSt. Vincent and the GrenadinesSudanSurinameSwazilandSwedenSwitzerlandSyrian Arab RepublicTajikistanTanzaniaThailandTimor-LesteTogoTongaTrinidad and TobagoTunisiaTurkeyTurkmenistanTuvaluUgandaUkraineUnited Arab EmiratesUnited KingdomUnited StatesUruguayUzbekistanVanuatuVenezuela, RBVietnamWest Bank and GazaZambiaZimbabwe
La ligne de temps
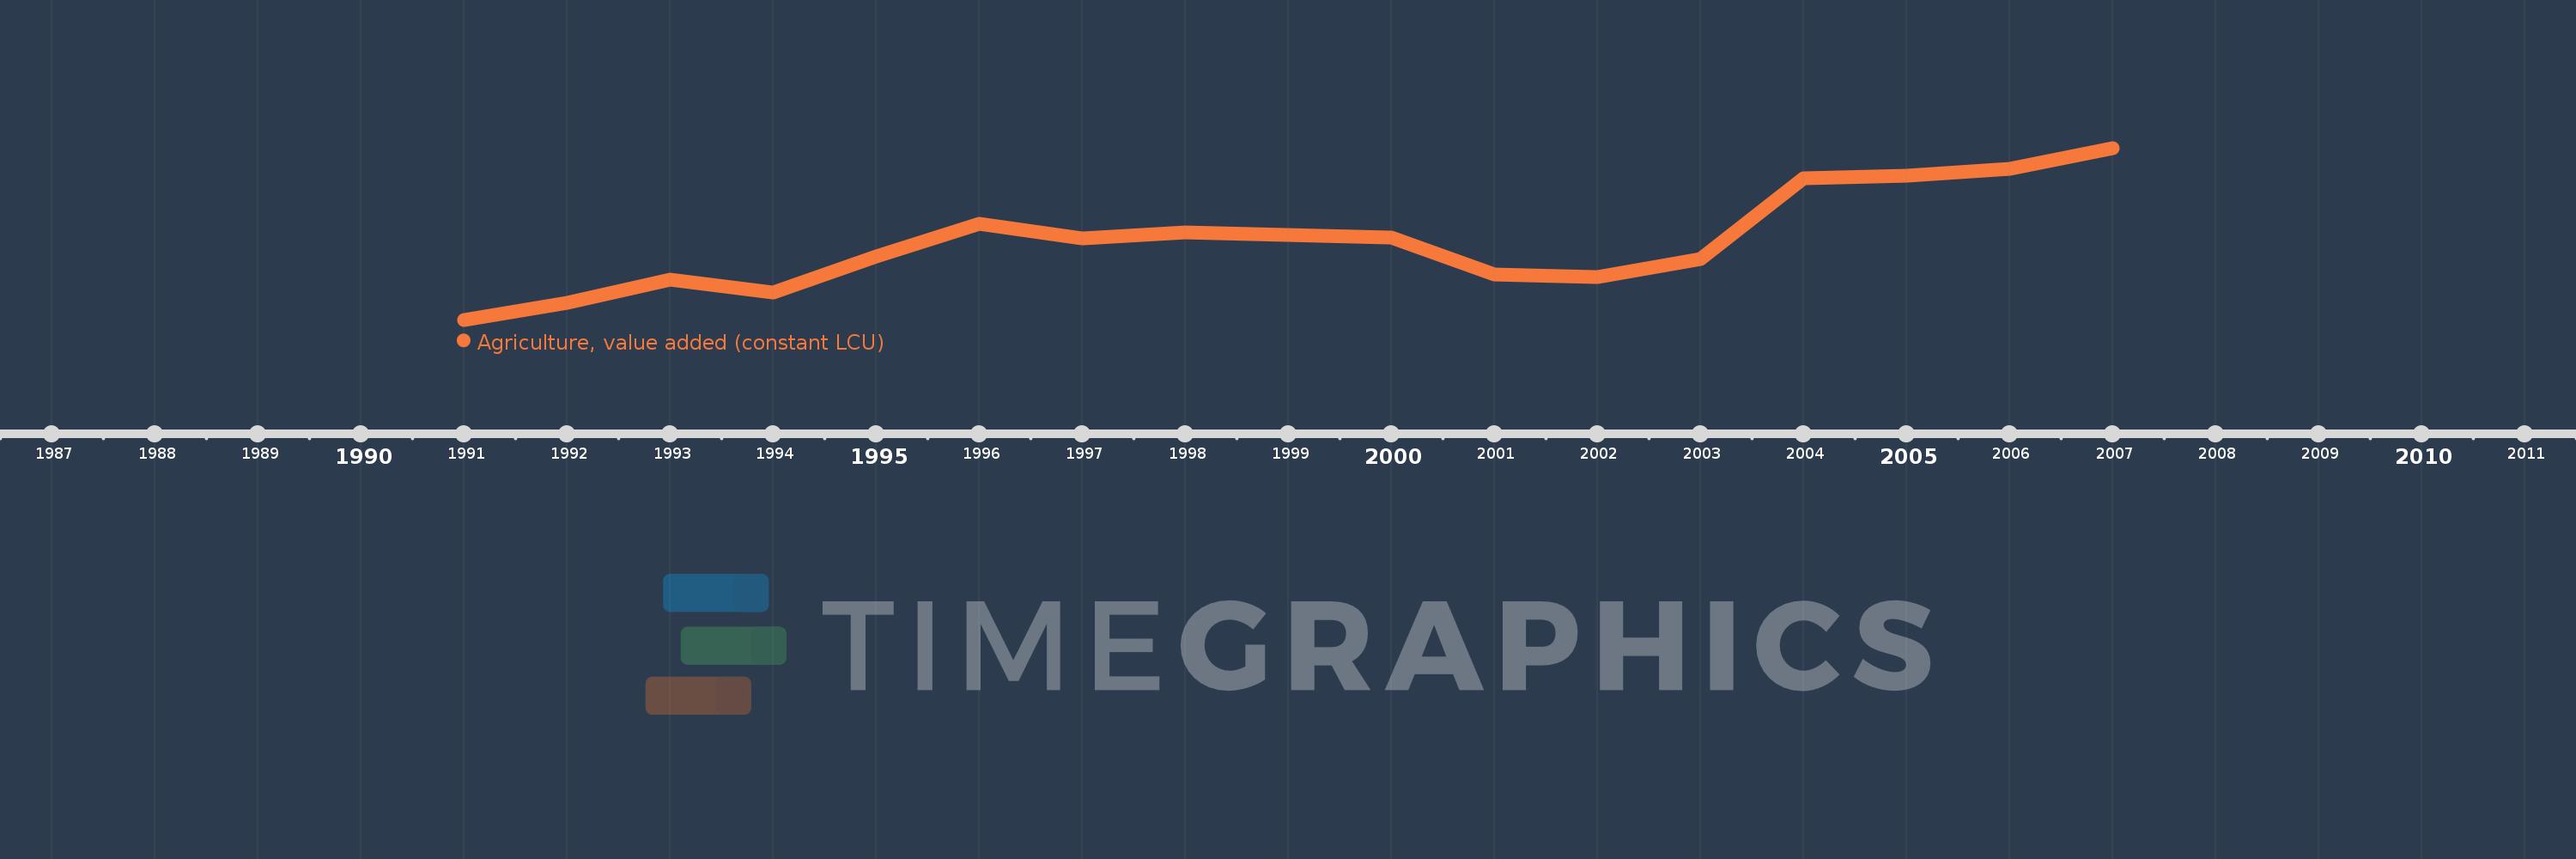
Cette échelle de temps montre un graphique de 1991 année à 2007 année Solomon Islands. Les données jusqu'à 1990 année ne sont pas présentés. Quantité d'observations actuelles selon dates: 17.
Source (désignation):
Les indicateurs du développement mondiale
Source (organisation):
World Bank national accounts data, and OECD National Accounts data files.
Catégories:
Economy & Growth
Dernière mise à jour
23 avr. 2017
Les indicateurs de changement de valeurs selon les années
En moyenne:
827.899 mln.
Minimum:
579.897 mln.
1 janv. 1991
Maximum:
1.122 mds
1 janv. 2007
Pour la date d''observation
Valeur
Changement absolu
Le changement par rapport à la valeur précédente
1 janv. 1991
579.897 mln.
+579.897 mln.
0.0%
1 janv. 1992
632.615 mln.
+52.718 mln.
9.09%
1 janv. 1993
707.53 mln.
+74.915 mln.
11.84%
1 janv. 1994
665.911 mln.
-41.619 mln.
-5.88%
1 janv. 1995
779.671 mln.
+113.76 mln.
17.08%
1 janv. 1996
882.332 mln.
+102.661 mln.
13.17%
1 janv. 1997
837.938 mln.
-44.394 mln.
-5.03%
1 janv. 1998
854.586 mln.
+16.648 mln.
1.99%
1 janv. 1999
846.262 mln.
-8.324 mln.
-0.97%
1 janv. 2000
840.712 mln.
-5.549 mln.
-0.66%
1 janv. 2001
722.791 mln.
-117.922 mln.
-14.03%
1 janv. 2002
715.299 mln.
-7.492 mln.
-1.04%
1 janv. 2003
770.439 mln.
+55.14 mln.
7.71%
1 janv. 2004
1.025 mds
+254.961 mln.
33.09%
1 janv. 2005
1.034 mds
+8.7 mln.
0.85%
1 janv. 2006
1.057 mds
+22.5 mln.
2.18%
1 janv. 2007
1.122 mds
+65.6 mln.
6.21%
Classement des pays selon les statistiques actuelles par années

Commentaires:

Envoyer
PremiumAbout & FeedbackUn accordConfidentialité
logo
© 2022 Selected Technologies LLC – Morgan Hill, California